News Corporation NWS
Revenue Intelligence Report • 41 quarters of SEC filing data • Updated 2026-03-15
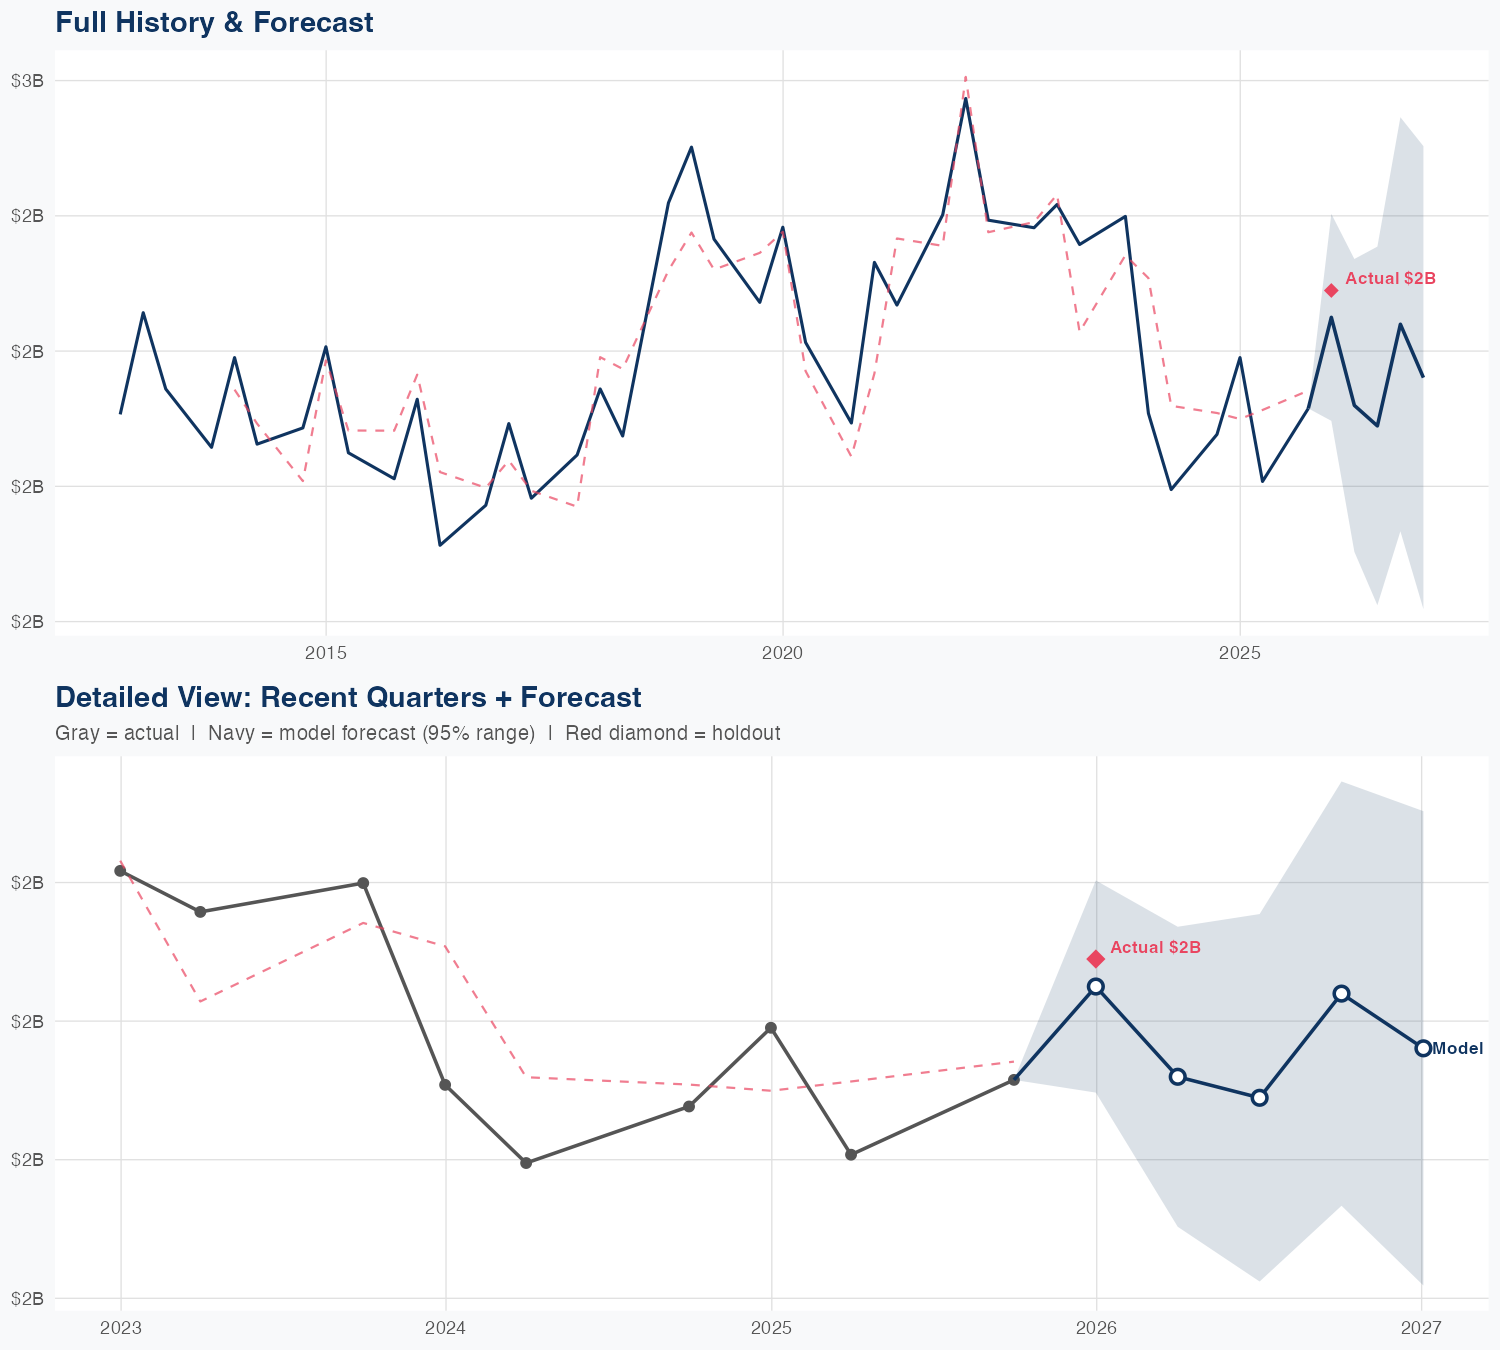
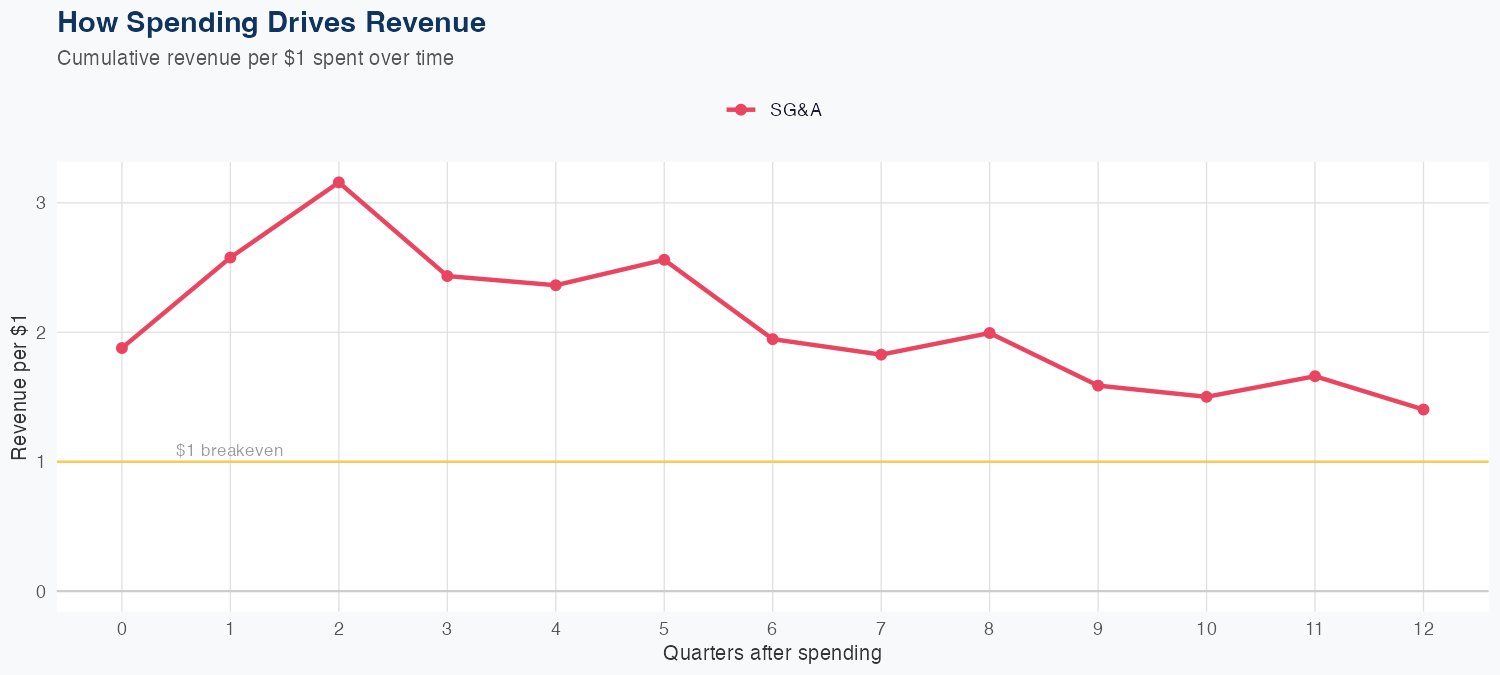
Quarterly revenue came in at $2.362 billion, backed by 41 quarters of data feeding a linear forecasting model. The revenue driver appears to be SG&A spending efficiency, with about $0.90 of long-run revenue generated per $1 of SG&A; R&D data are not available in the model. The model delivers 3.9% MAPE and a holdout test predicting $2.3B versus actual $2.4B, a 3.0% error, indicating reasonable predictive reliability. The FY revenue forecast is $8.7B, down 0.6% year over year, signaling a flat to modestly negative top-line outlook despite SG&A leverage.
Investment Thesis
The econometric model achieves strong accuracy (3.9% MAPE), suggesting News Corporation's revenue trajectory is well-characterized by its spending patterns. Each $1 of SG&A spending generates $0.90 in revenue, reflecting strong commercial efficiency.
Revenue Forecast
Quarterly Detail
| Quarter | Model Forecast | Actual | 95% Range | YoY Growth | Status |
|---|---|---|---|---|---|
| Q4 2025 | $2.3B | $2.4B | $2.1B – $2.5B | +9.3% | ✓ In range |
| Q2 2026 | $2.1B | $1.8B – $2.5B | -4.3% | ||
| Q3 2026 | $2.1B | $1.8B – $2.5B | +6.9% | ||
| Q4 2026 | $2.2B | $1.8B – $2.7B | +4.7% | ||
| Q1 2027 | $2.2B | $1.7B – $2.7B | -8.3% |
Seasonal Factors
| Fiscal Quarter | Seasonal Factor | vs Trend | Interpretation | Obs. |
|---|---|---|---|---|
| FQ1 (Sep–Nov) | 1.0204 | +2.0% | In line with trend | 12 |
| FQ2 (Dec–Feb) | 1.0165 | +1.7% | In line with trend | 13 |
| FQ3 (Mar–May) | 0.9919 | -0.8% | In line with trend | 12 |
| FQ4 (Jun–Aug) | 1.0 | +0.0% | In line with trend | 0 |
How Spending Drives Revenue
Want this analysis for your portfolio?
I build custom revenue intelligence reports for investors and companies using SEC filing data, econometric modeling, and AI-powered insights.
Get in Touch