Pultegroup, Inc. PHM
Revenue Intelligence Report • 63 quarters of SEC filing data • Updated 2026-03-15
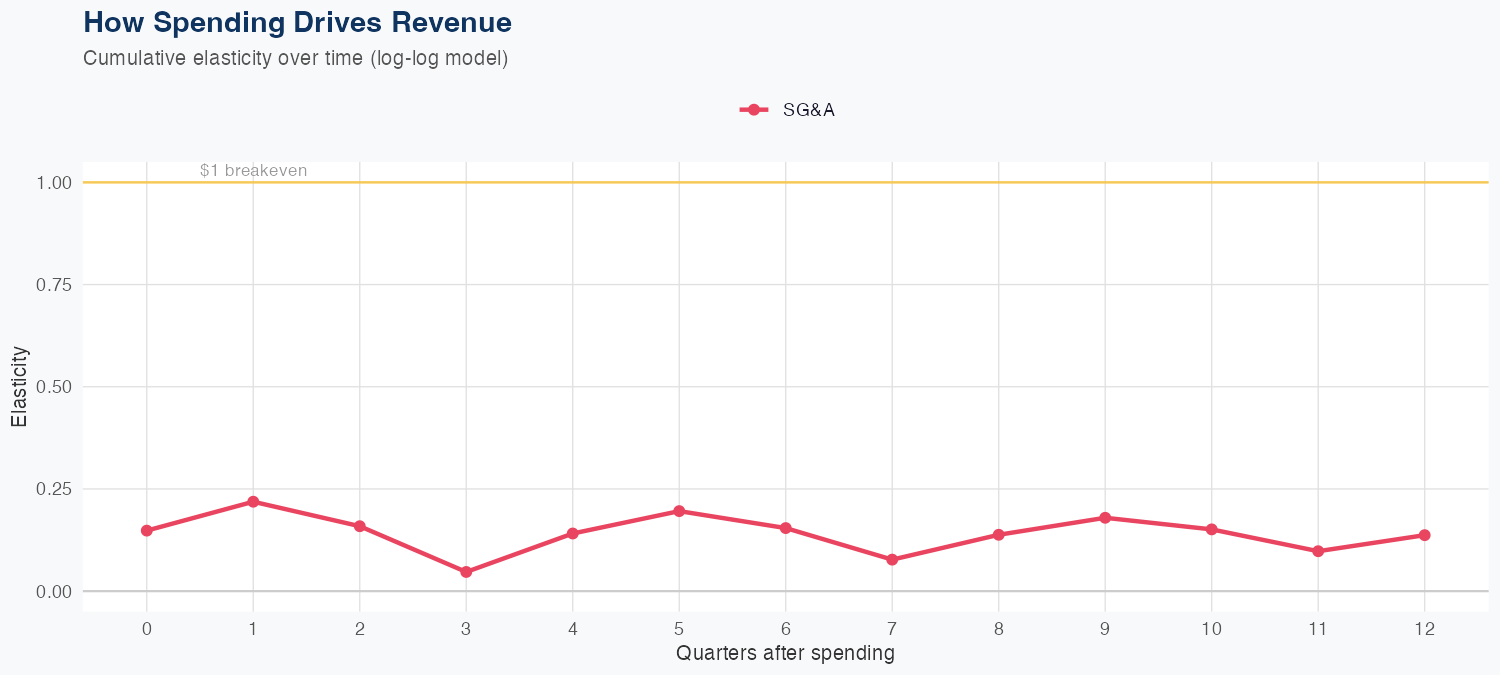
Revenue is driven by SG&A spending, with a modest elasticity of about 0.14% increase in revenue for each 1% rise in SG&A, implying selling and marketing initiatives contribute positively to the top line but with limited leverage. The ROI of SG&A appears positive but modest, given the small elasticity and a holdout test showing around a 9% forecast miss (predicted $5.0B vs actual $4.6B), indicating some forecast sensitivity to spend and mix. Latest quarterly revenue was $4,611M, and the full-year forecast is $19B, up 10.8% year over year, signaling solid demand and a favorable growth trajectory. Outlook remains constructive with double-digit revenue growth expected, though investors should monitor margins and operating leverage to gauge true ROIC on SG&A investments alongside top-line gains.
Investment Thesis
At 8.6% MAPE, the model captures Pultegroup, Inc.'s broad revenue trajectory, though quarterly variability suggests sensitivity to external factors. Sales & marketing spend shows a 0.14x elasticity, suggesting effective go-to-market execution.
Revenue Forecast
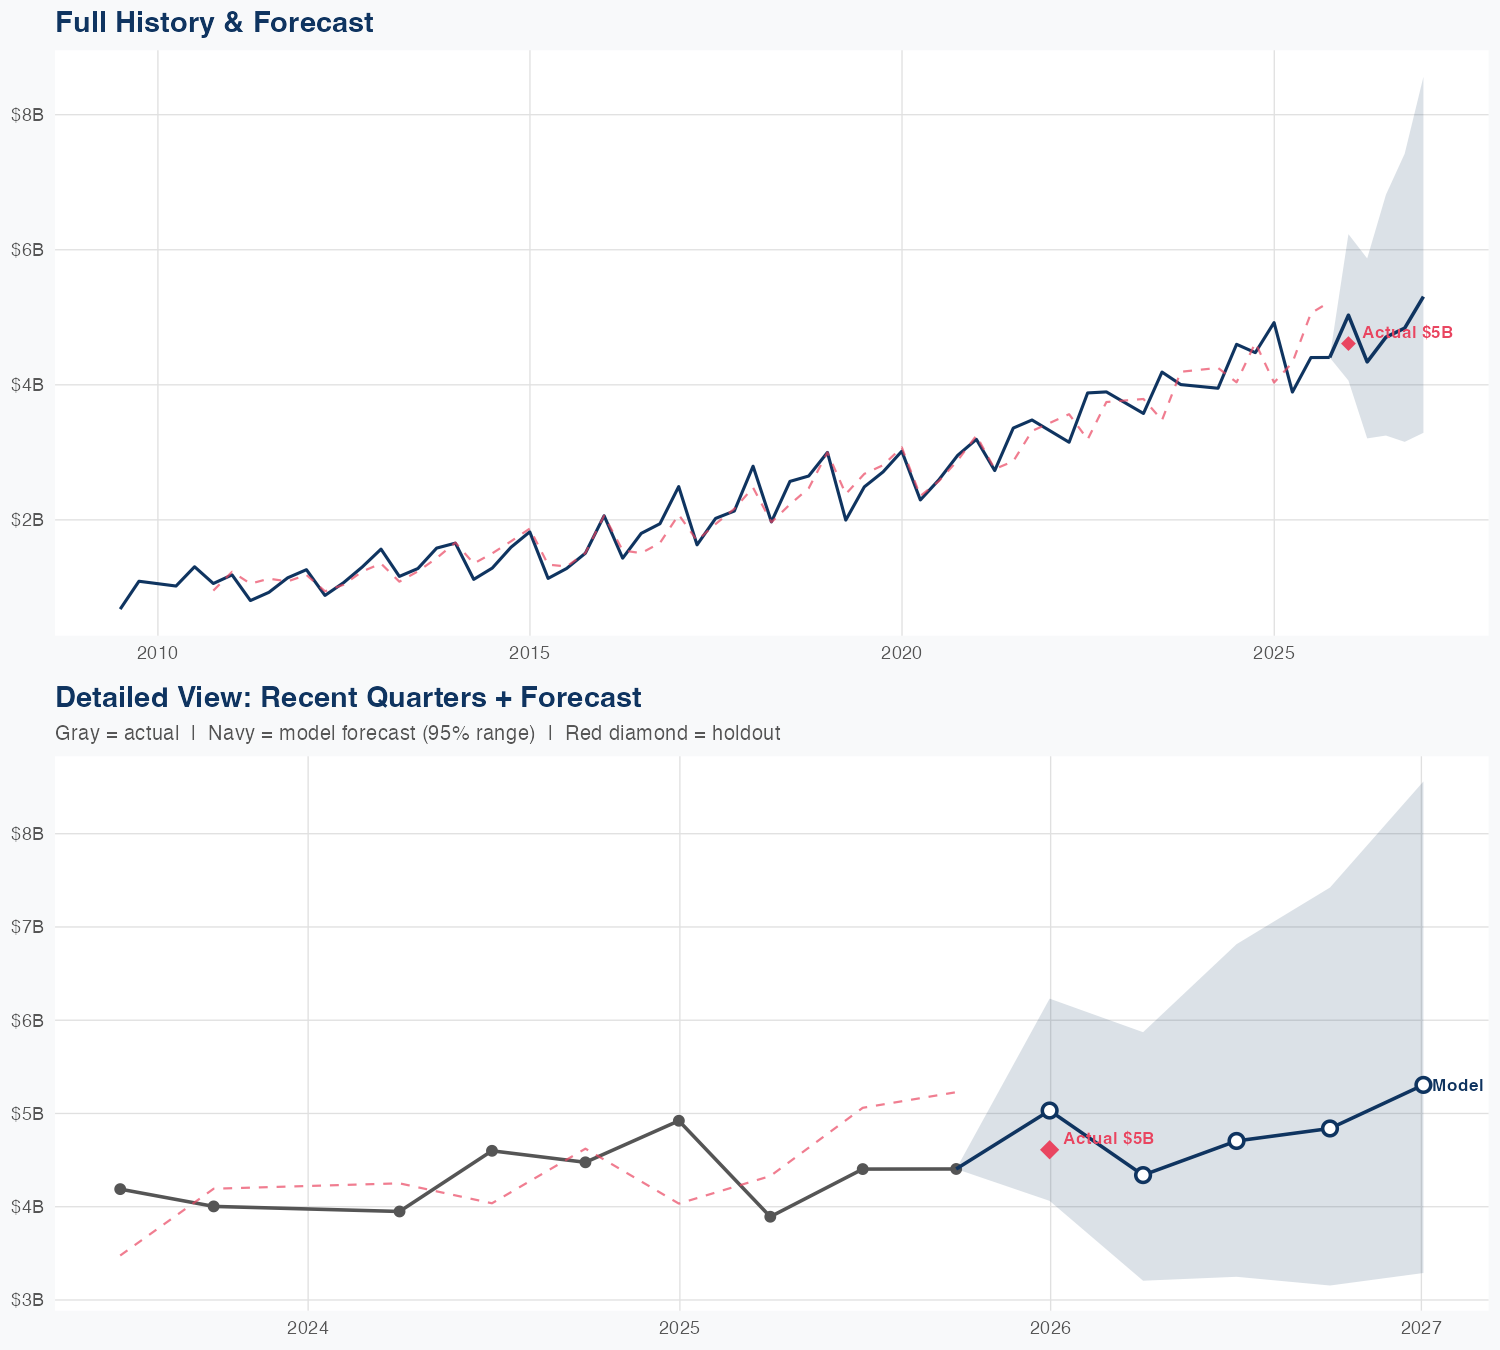
Quarterly Detail
| Quarter | Model Forecast | Actual | 95% Range | YoY Growth | Status |
|---|---|---|---|---|---|
| Q4 2025 | $5.0B | $4.6B | $4.1B – $6.2B | +2.2% | ✓ In range |
| Q2 2026 | $4.3B | $3.2B – $5.9B | +11.5% | ||
| Q3 2026 | $4.7B | $3.2B – $6.8B | +6.8% | ||
| Q4 2026 | $4.8B | $3.2B – $7.4B | +9.9% | ||
| Q1 2027 | $5.3B | $3.3B – $8.6B | +15.1% |
Seasonal Factors
| Fiscal Quarter | Seasonal Factor | vs Trend | Interpretation | Obs. |
|---|---|---|---|---|
| FQ1 (Sep–Nov) | 1.0401 | +4.0% | +4.0% above trend | 16 |
| FQ2 (Dec–Feb) | 0.9992 | -0.1% | In line with trend | 13 |
| FQ3 (Mar–May) | 0.929 | -7.1% | -7.1% below trend | 15 |
| FQ4 (Jun–Aug) | 1.0339 | +3.4% | +3.4% above trend | 15 |
How Spending Drives Revenue
Want this analysis for your portfolio?
I build custom revenue intelligence reports for investors and companies using SEC filing data, econometric modeling, and AI-powered insights.
Get in Touch