Udr, Inc. UDR
Revenue Intelligence Report • 51 quarters of SEC filing data • Updated 2026-03-15
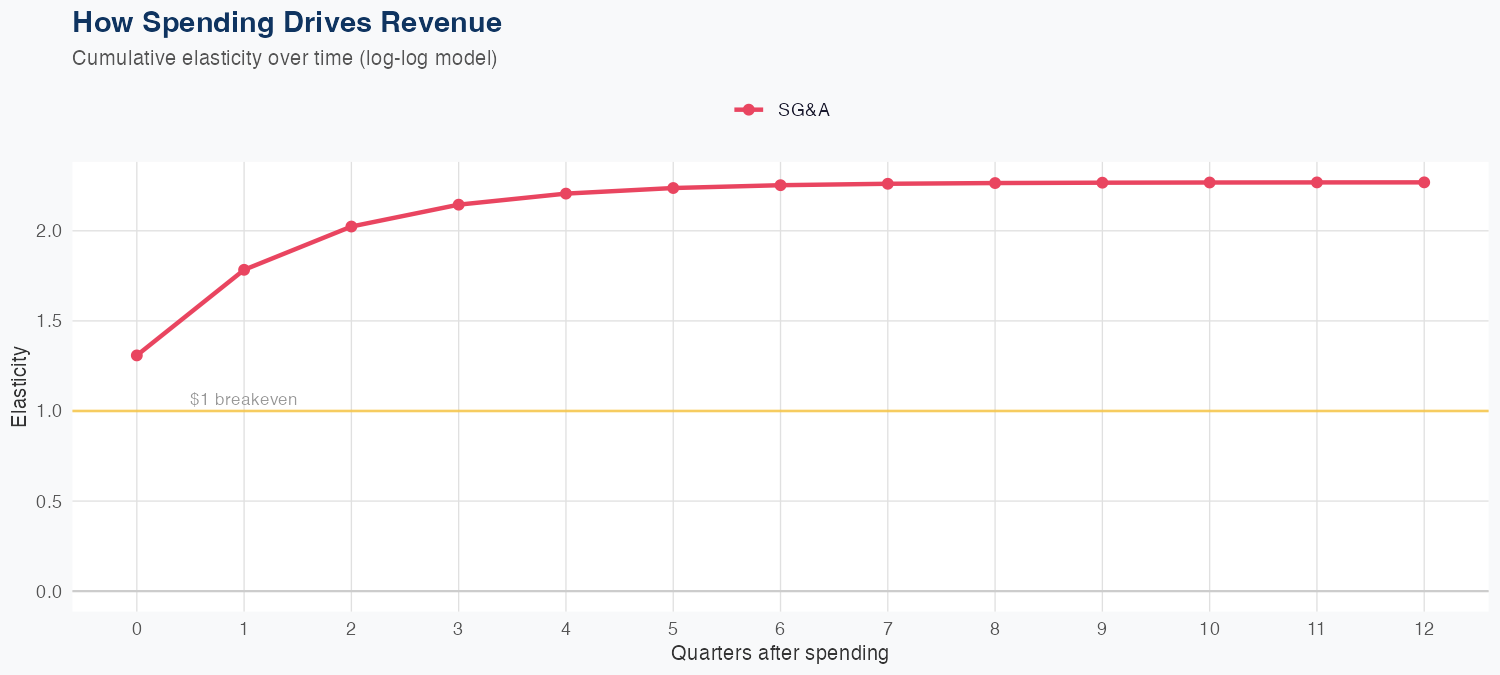
A log-log model indicates revenue is positively driven by SG&A spending, with an elasticity of 0.14% in revenue per 1% SG&A increase; R&D data are not available for assessment. The model shows good predictive accuracy, with a holdout prediction of 438M versus 433M actual (about -1.2%), and an overall MAPE of 1.7% over 51 quarters. Latest quarterly revenue is 433M, and the full-year forecast is 1,819M, up 6.2% year over year, signaling ongoing growth momentum. The ROI on SG&A spending appears modest, suggesting upside from efficiency improvements and other revenue-enhancing strategies to sustain the positive outlook.
Investment Thesis
Our ARDL model tracks Udr, Inc.'s revenue with exceptional precision (1.7% MAPE), indicating highly predictable cash flows. Sales & marketing spend shows a 0.14x elasticity, suggesting effective go-to-market execution.
Revenue Forecast
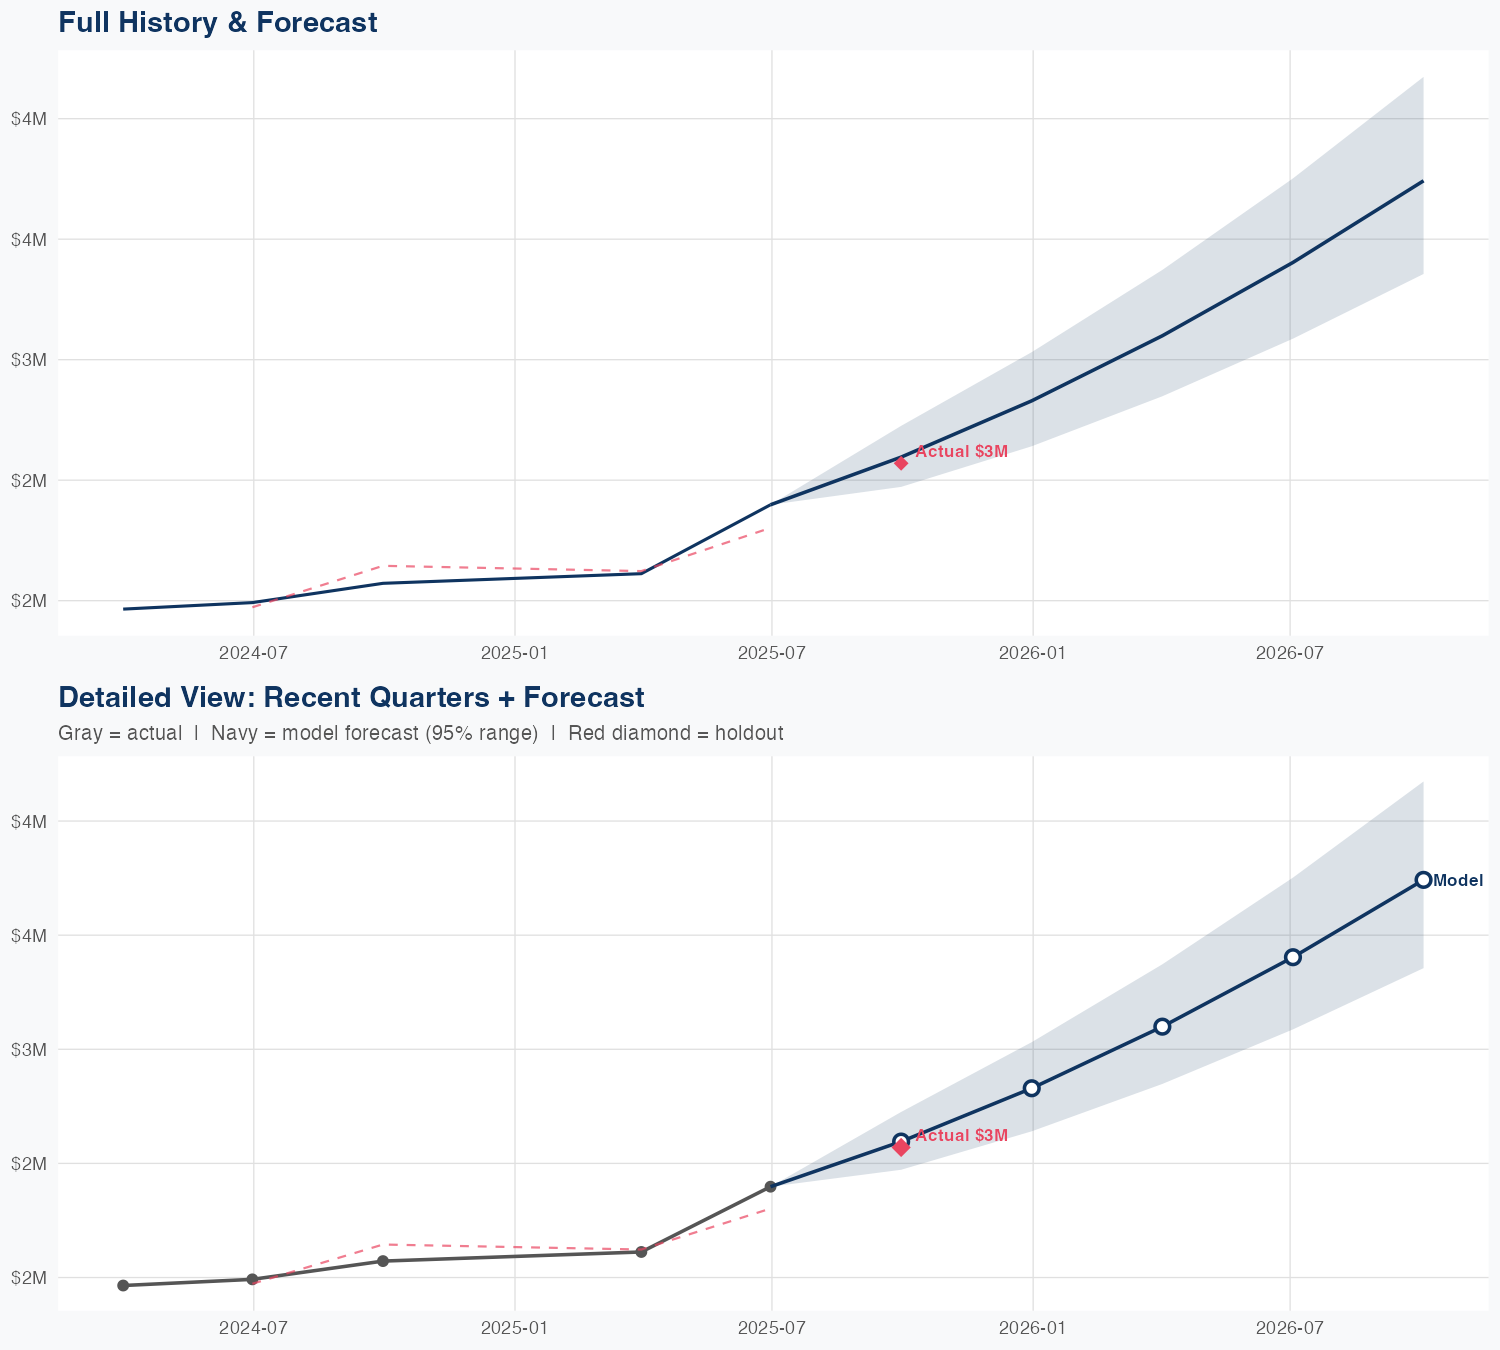
Quarterly Detail
| Quarter | Model Forecast | Actual | 95% Range | YoY Growth | Status |
|---|---|---|---|---|---|
| Q4 2025 | $438B | $433B | $417B – $461B | +3.7% | ✓ In range |
| Q2 2026 | $445B | $414B – $478B | +5.4% | ||
| Q3 2026 | $451B | $414B – $493B | +6.1% | ||
| Q4 2026 | $458B | $414B – $507B | +6.0% | ||
| Q1 2027 | $465B | $415B – $520B | +7.3% |
Seasonal Factors
| Fiscal Quarter | Seasonal Factor | vs Trend | Interpretation | Obs. |
|---|---|---|---|---|
| FQ1 (Sep–Nov) | 1.0004 | +0.0% | In line with trend | 13 |
| FQ2 (Dec–Feb) | 0.9894 | -1.1% | In line with trend | 12 |
| FQ3 (Mar–May) | 0.9934 | -0.7% | In line with trend | 12 |
| FQ4 (Jun–Aug) | 1.0003 | +0.0% | In line with trend | 13 |
How Spending Drives Revenue
Want this analysis for your portfolio?
I build custom revenue intelligence reports for investors and companies using SEC filing data, econometric modeling, and AI-powered insights.
Get in Touch