Weyerhaeuser Co WY
Revenue Intelligence Report • 56 quarters of SEC filing data • Updated 2026-03-15
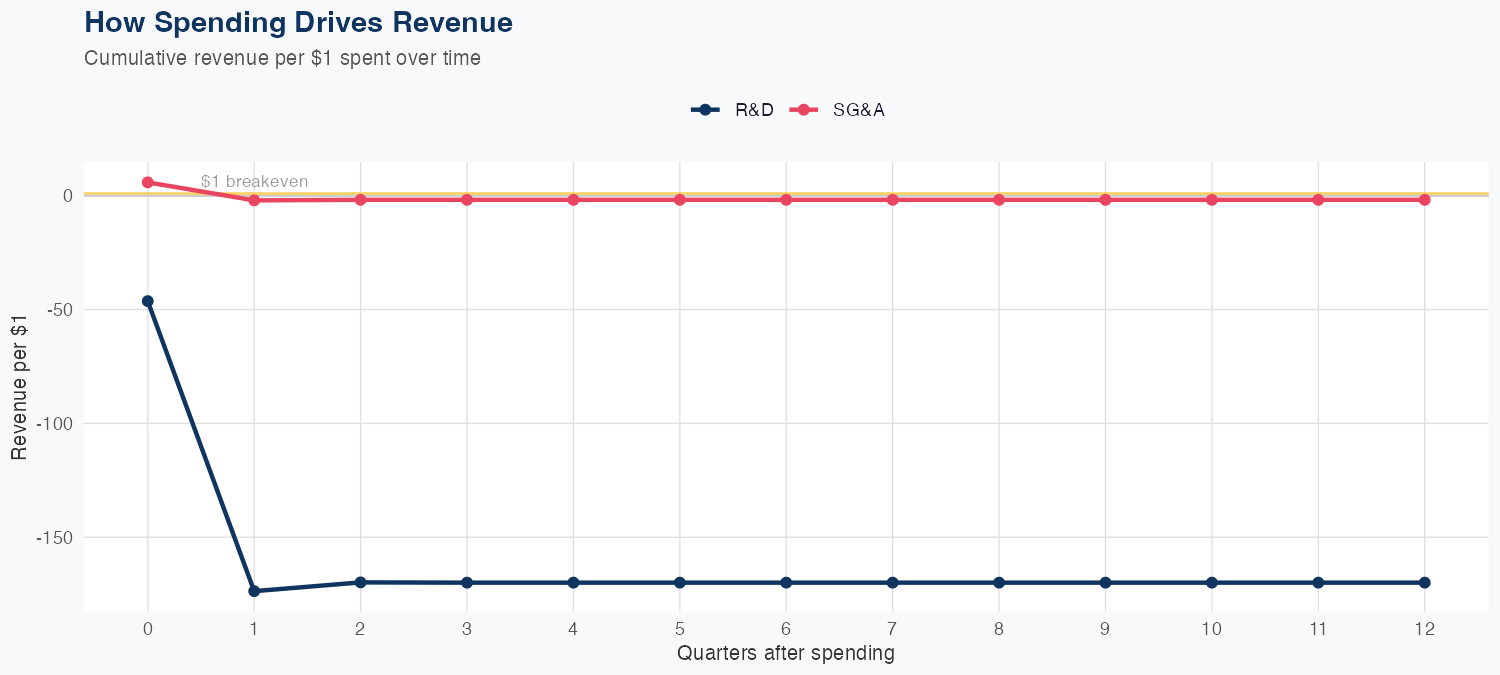
Revenue drivers appear to be SG&A spending, which shows a positive elasticity of 0.51% in revenue per 1% SG&A increase, while R&D displays a small negative elasticity of -0.06%. The model uses 56 quarters of data and achieves 7.9% MAPE, but a holdout test overpredicted by about 17% (1.8B forecast vs 1.5B actual), signaling forecasting uncertainty. The FY revenue forecast is 7.8B, about 13.5% higher year over year, implying a solid top-line trajectory if SG&A-driven momentum sustains. Investors should weigh the positive ROI implied by SG&A spending against the limited revenue contribution from R&D and the model’s known error margins when assessing the outlook.
Investment Thesis
The econometric model achieves strong accuracy (7.9% MAPE), suggesting Weyerhaeuser Co's revenue trajectory is well-characterized by its spending patterns. R&D spending currently shows a negative elasticity (-0.06x), which can indicate heavy investment in long-cycle initiatives not yet reflected in revenue. Sales & marketing spend shows a 0.51x elasticity, suggesting effective go-to-market execution.
Revenue Forecast
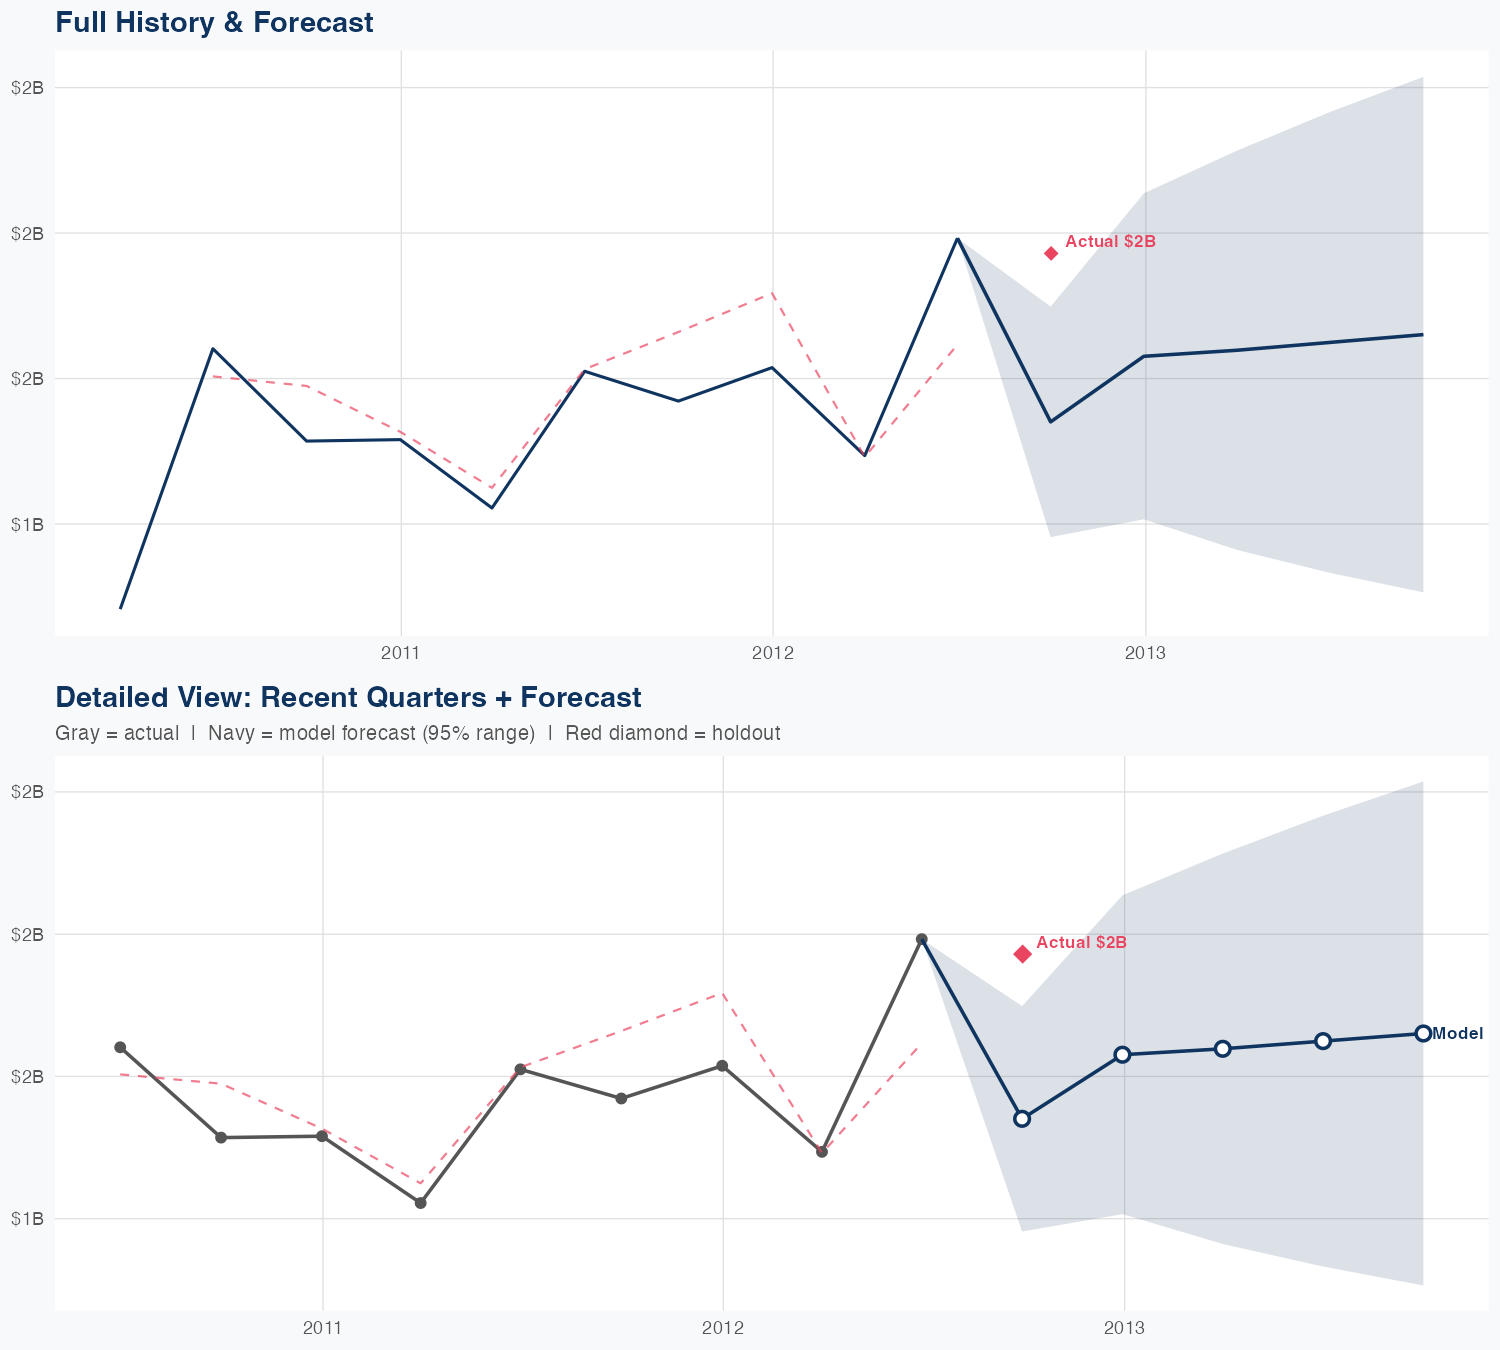
Quarterly Detail
| Quarter | Model Forecast | Actual | 95% Range | YoY Growth | Status |
|---|---|---|---|---|---|
| Q4 2025 | $1.8B | $1.5B | $1.4B – $2.2B | +5.6% | ✓ In range |
| Q2 2026 | $1.9B | $1.4B – $2.6B | +7.0% | ||
| Q3 2026 | $1.9B | $1.3B – $2.8B | +3.3% | ||
| Q4 2026 | $2.0B | $1.3B – $3.1B | +15.8% | ||
| Q1 2027 | $2.0B | $1.2B – $3.3B | +31.0% |
Seasonal Factors
| Fiscal Quarter | Seasonal Factor | vs Trend | Interpretation | Obs. |
|---|---|---|---|---|
| FQ1 (Sep–Nov) | 0.975 | -2.5% | In line with trend | 14 |
| FQ2 (Dec–Feb) | 0.9428 | -5.7% | -5.7% below trend | 14 |
| FQ3 (Mar–May) | 1.0303 | +3.0% | +3.0% above trend | 13 |
| FQ4 (Jun–Aug) | 1.0522 | +5.2% | +5.2% above trend | 14 |
How Spending Drives Revenue
Want this analysis for your portfolio?
I build custom revenue intelligence reports for investors and companies using SEC filing data, econometric modeling, and AI-powered insights.
Get in Touch