Franklin Resources, Inc. BEN
Revenue Intelligence Report • 49 quarters of SEC filing data • Updated 2026-03-15
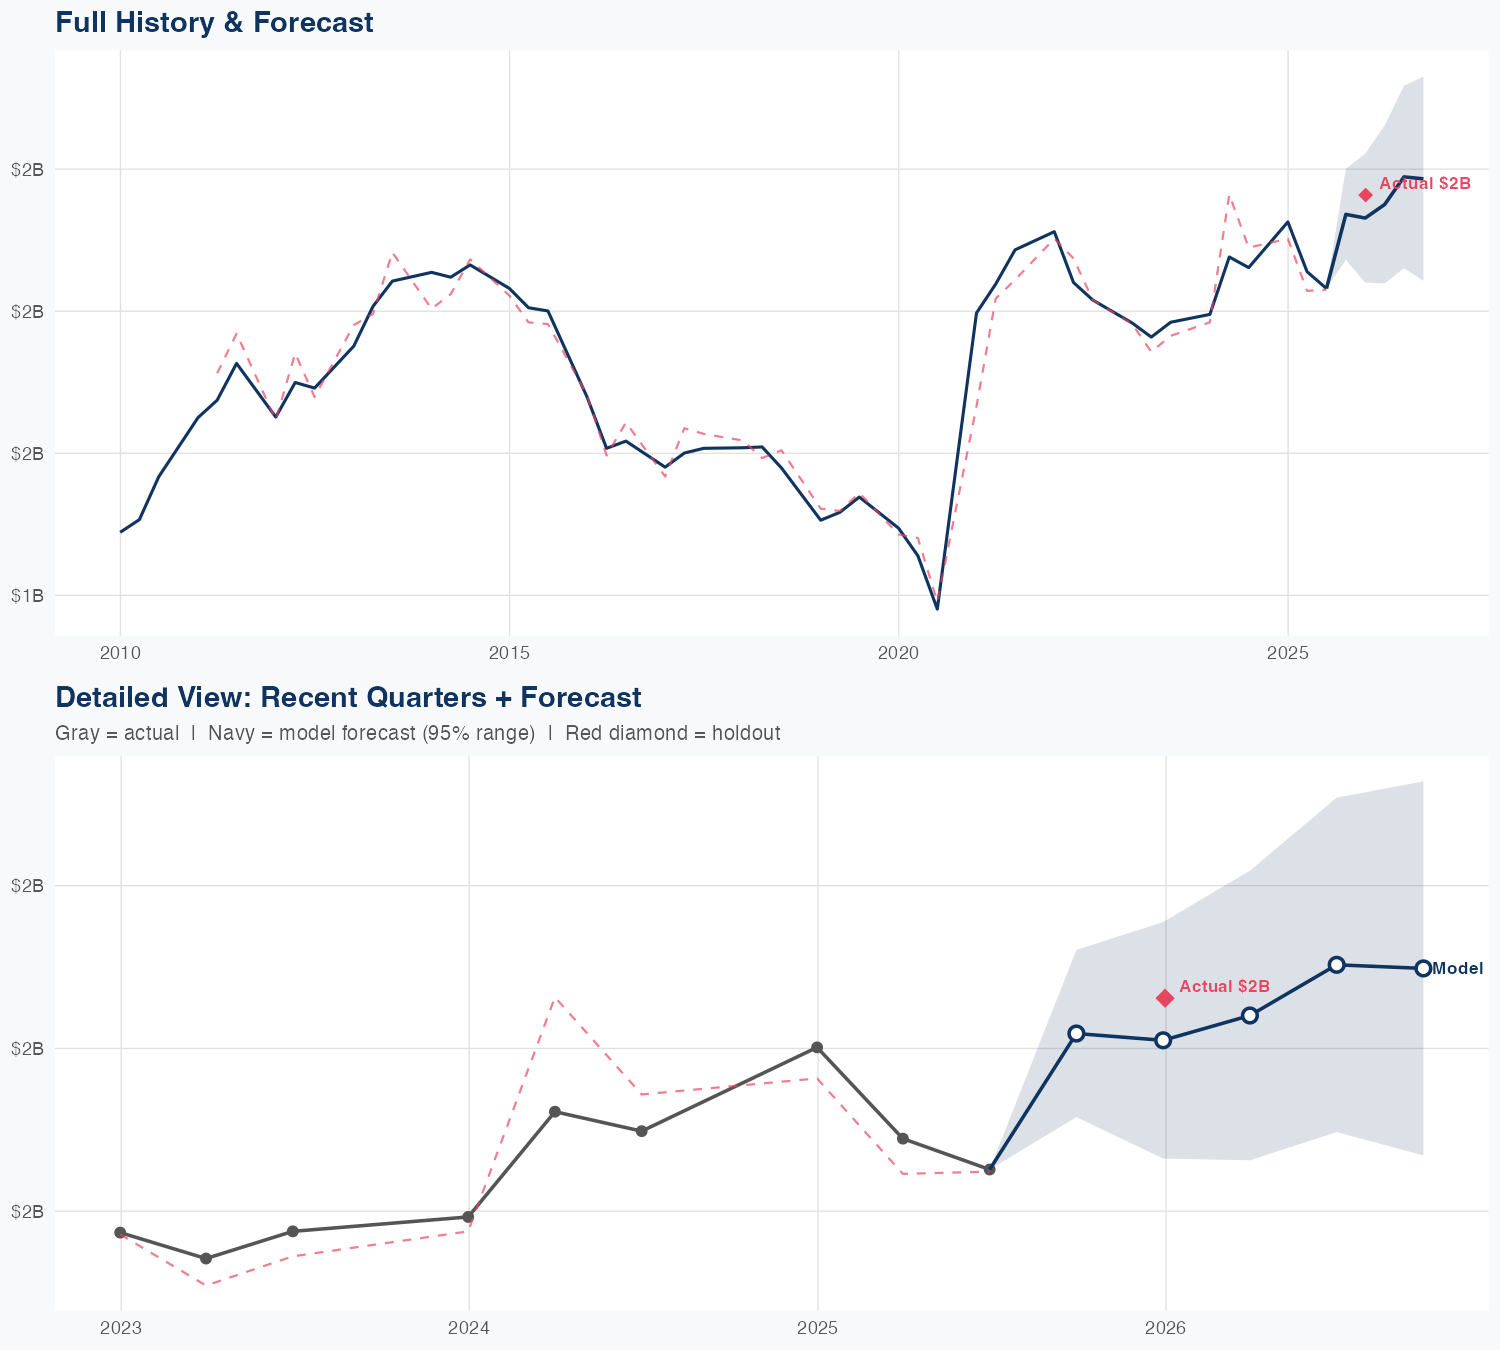
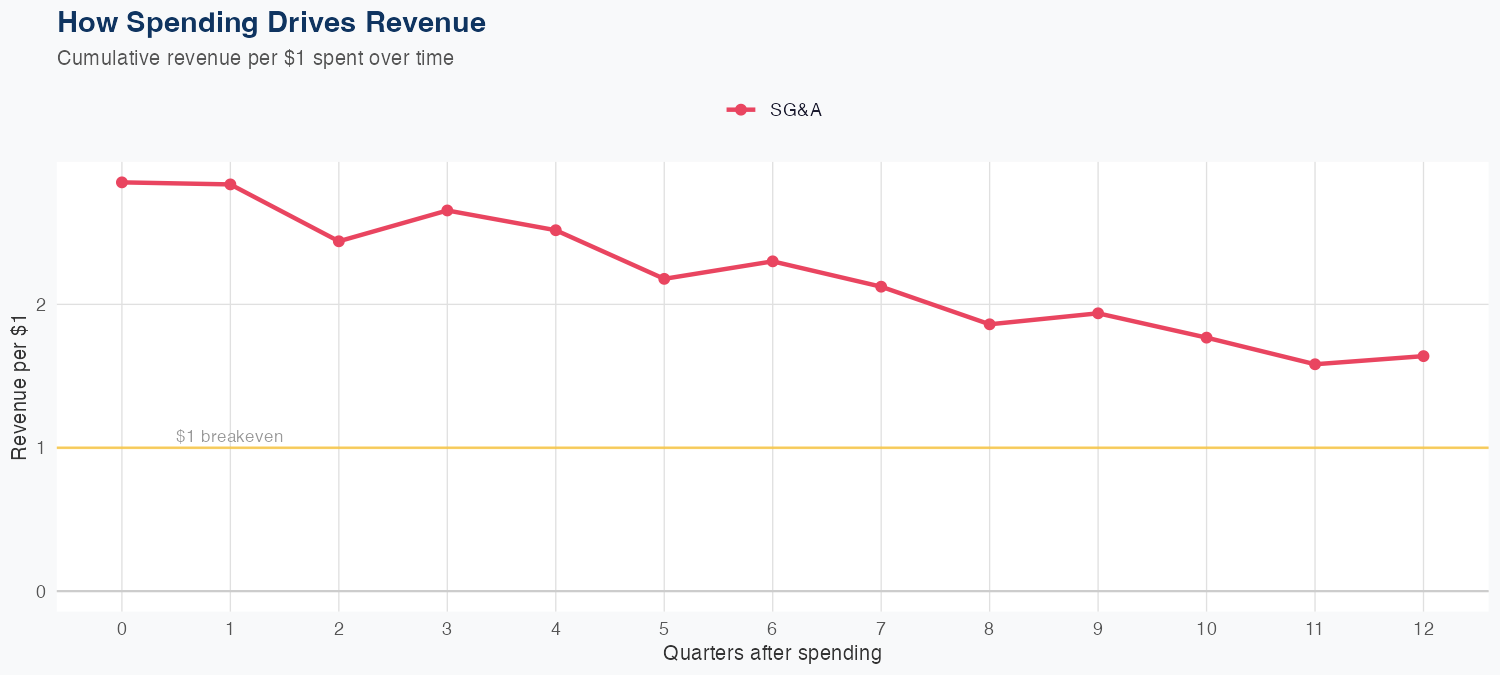
Revenue is driven by SG&A spending efficiency, with every $1 of SG&A generating $1.60 in long-run revenue, implying a 1.60x ROI on SG&A investments. A linear model with 2.4% MAPE and a holdout test predicting $2.3B versus actual $2.3B demonstrates forecasting credibility. The latest quarterly revenue was $2.327B, aligning with the near-term trajectory. For the full year, revenue is forecast at $9.3B, up 6.1% year over year, indicating a steady growth path supported by SG&A-driven revenue expansion.
Investment Thesis
Our ARDL model tracks Franklin Resources, Inc.'s revenue with exceptional precision (2.4% MAPE), indicating highly predictable cash flows. Each $1 of SG&A spending generates $1.60 in revenue, reflecting strong commercial efficiency.
Revenue Forecast
Quarterly Detail
| Quarter | Model Forecast | Actual | 95% Range | YoY Growth | Status |
|---|---|---|---|---|---|
| Q3 2025 | $2.3B | $2.3B | $2.1B – $2.4B | +6.9% | ✓ In range |
| Q4 2025 | $2.3B | $2.1B – $2.4B | +0.2% | ||
| Q1 2026 | $2.3B | $2.1B – $2.5B | +8.7% | ||
| Q2 2026 | $2.4B | $2.1B – $2.6B | +15.0% | ||
| Q3 2026 | $2.4B | $2.1B – $2.6B | +1.6% |
Seasonal Factors
| Fiscal Quarter | Seasonal Factor | vs Trend | Interpretation | Obs. |
|---|---|---|---|---|
| FQ1 (Sep–Nov) | 1.0 | +0.0% | In line with trend | 0 |
| FQ2 (Dec–Feb) | 1.0087 | +0.9% | In line with trend | 15 |
| FQ3 (Mar–May) | 1.0108 | +1.1% | In line with trend | 15 |
| FQ4 (Jun–Aug) | 0.9938 | -0.6% | In line with trend | 15 |
How Spending Drives Revenue
Want this analysis for your portfolio?
I build custom revenue intelligence reports for investors and companies using SEC filing data, econometric modeling, and AI-powered insights.
Get in Touch