Boston Scientific Corporation BSX
Revenue Intelligence Report • 70 quarters of SEC filing data • Updated 2026-03-15
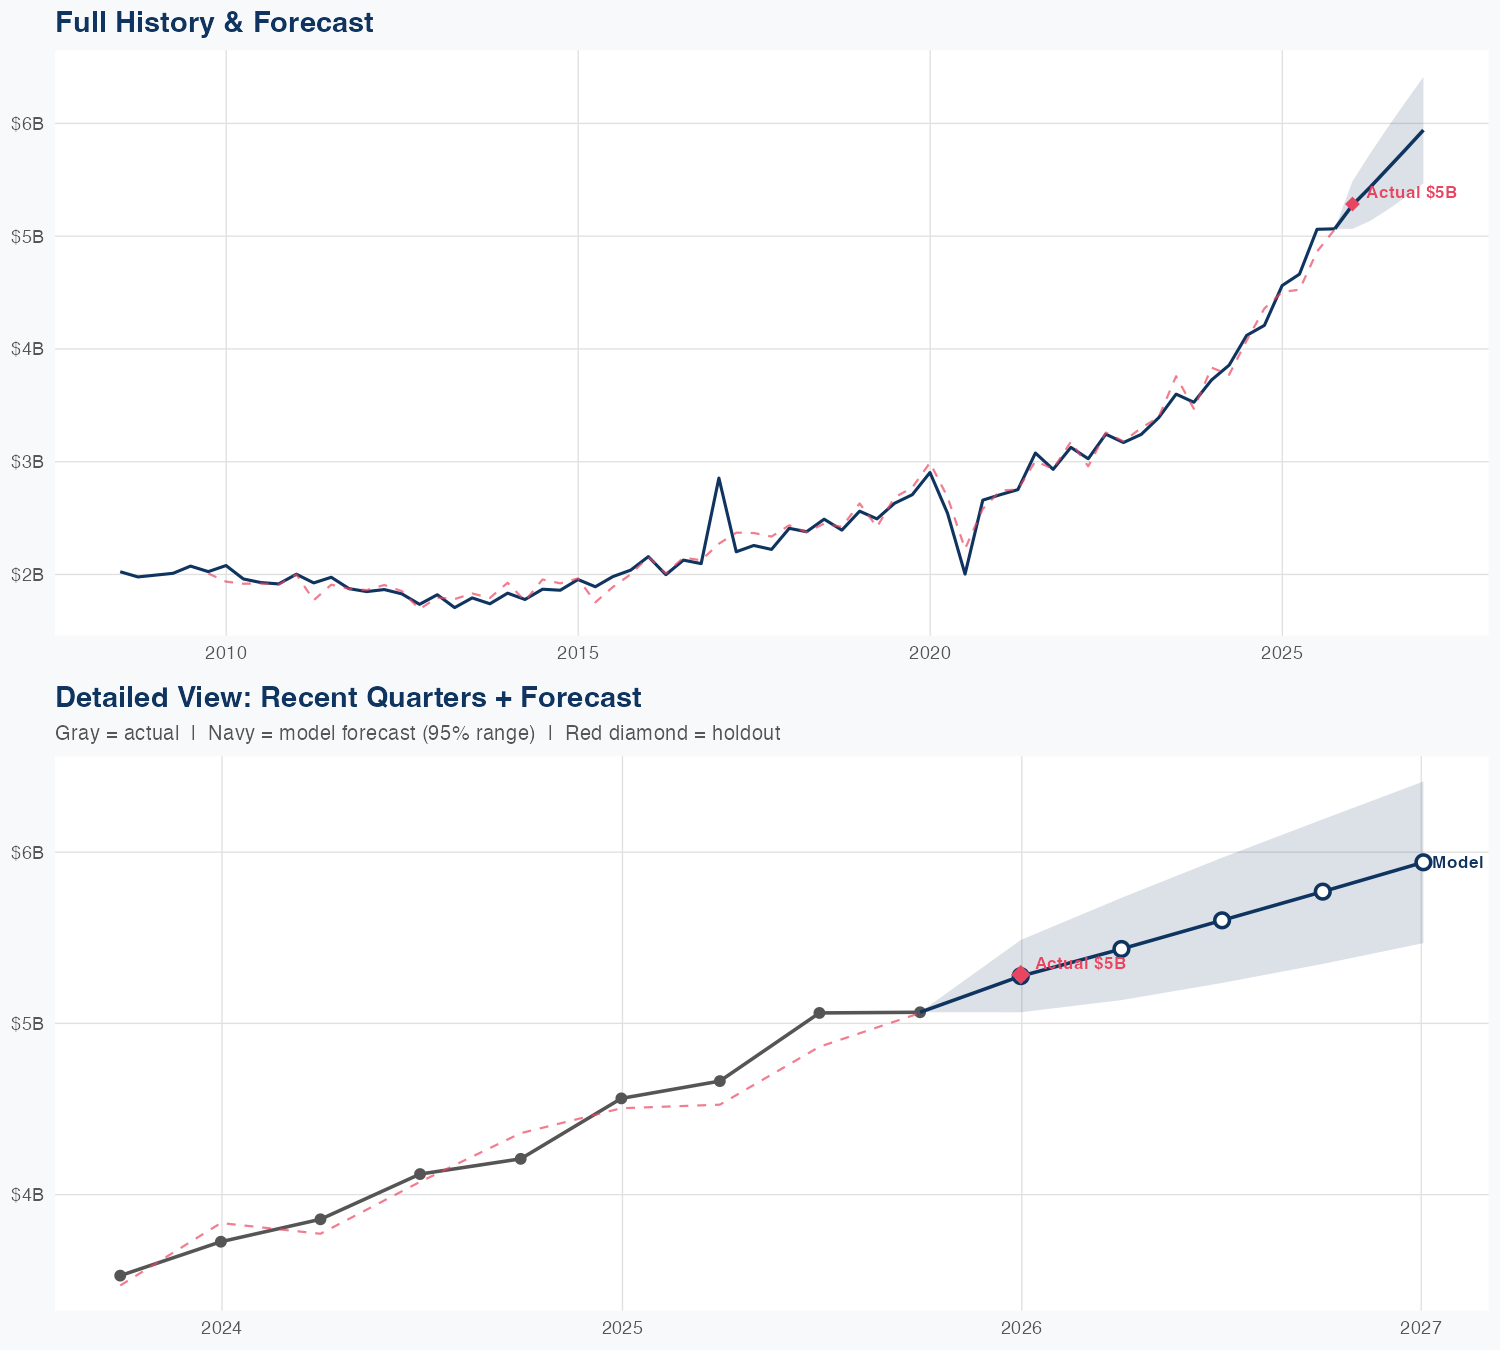
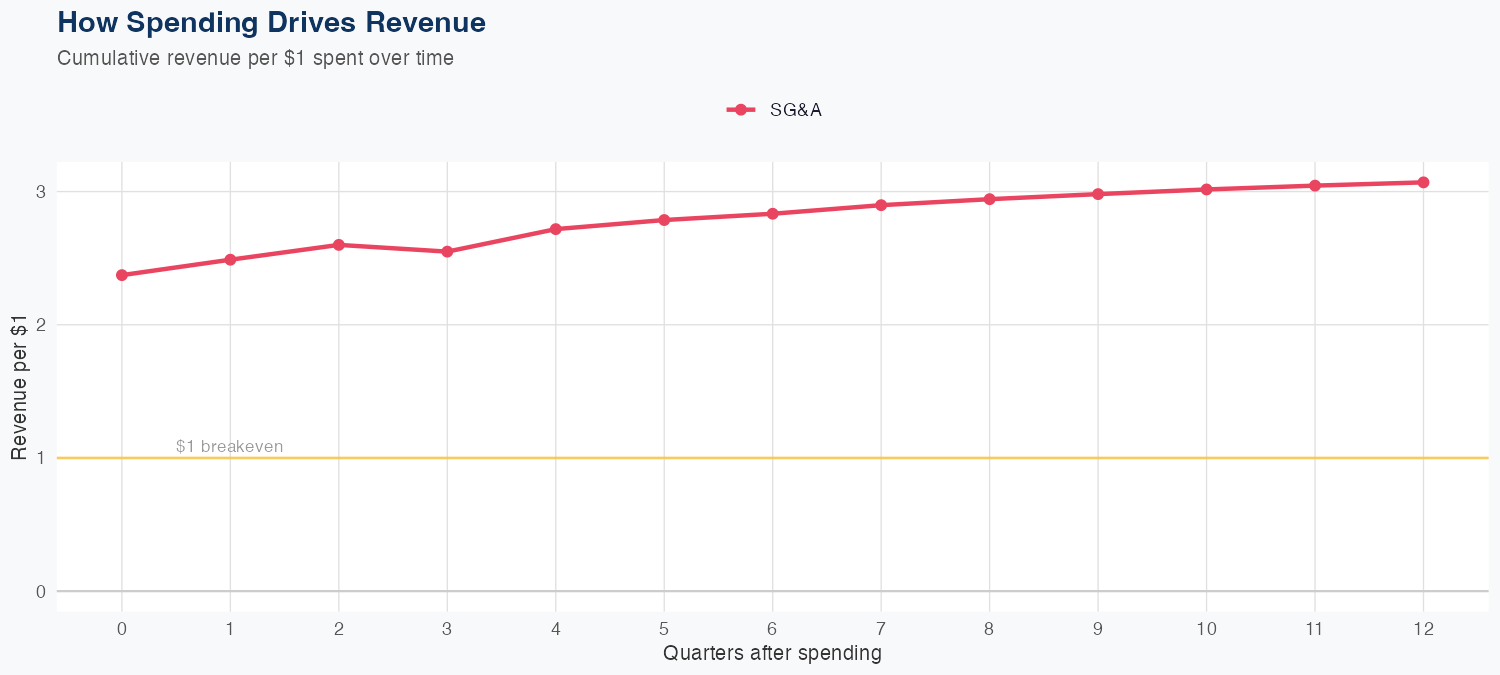
Revenue dynamics are driven by SG&A efficiency, with $1 of SG&A spending generating $3.07 in long-run revenue, and R&D data not available for this model. The linear model, built on 70 quarters of data, achieves 2.7% MAPE accuracy, with holdout tests predicting $5.3B vs actual $5.3B (0.1% error), indicating reliable forecasting. The latest quarterly revenue is $5.285B, reflecting a scalable platform consistent with the ROI dynamics observed. The outlook calls for $23B in revenue this fiscal year, up 13.3% year over year, underscoring solid growth momentum and the continued importance of SG&A-driven ROI for upside.
Investment Thesis
Our ARDL model tracks Boston Scientific Corporation's revenue with exceptional precision (2.7% MAPE), indicating highly predictable cash flows. Each $1 of SG&A spending generates $3.07 in revenue, reflecting strong commercial efficiency.
Revenue Forecast
Quarterly Detail
| Quarter | Model Forecast | Actual | 95% Range | YoY Growth | Status |
|---|---|---|---|---|---|
| Q4 2025 | $5.3B | $5.3B | $5.1B – $5.5B | +15.7% | ✓ In range |
| Q2 2026 | $5.4B | $5.1B – $5.7B | +16.5% | ||
| Q3 2026 | $5.6B | $5.2B – $6.0B | +10.7% | ||
| Q4 2026 | $5.8B | $5.3B – $6.2B | +13.9% | ||
| Q1 2027 | $5.9B | $5.5B – $6.4B | +12.4% |
Seasonal Factors
| Fiscal Quarter | Seasonal Factor | vs Trend | Interpretation | Obs. |
|---|---|---|---|---|
| FQ1 (Sep–Nov) | 0.9986 | -0.1% | In line with trend | 17 |
| FQ2 (Dec–Feb) | 0.9907 | -0.9% | In line with trend | 17 |
| FQ3 (Mar–May) | 1.0076 | +0.8% | In line with trend | 16 |
| FQ4 (Jun–Aug) | 0.9956 | -0.4% | In line with trend | 16 |
How Spending Drives Revenue
Want this analysis for your portfolio?
I build custom revenue intelligence reports for investors and companies using SEC filing data, econometric modeling, and AI-powered insights.
Get in Touch