Cardinal Health, Inc. CAH
Revenue Intelligence Report • 65 quarters of SEC filing data • Updated 2026-03-15
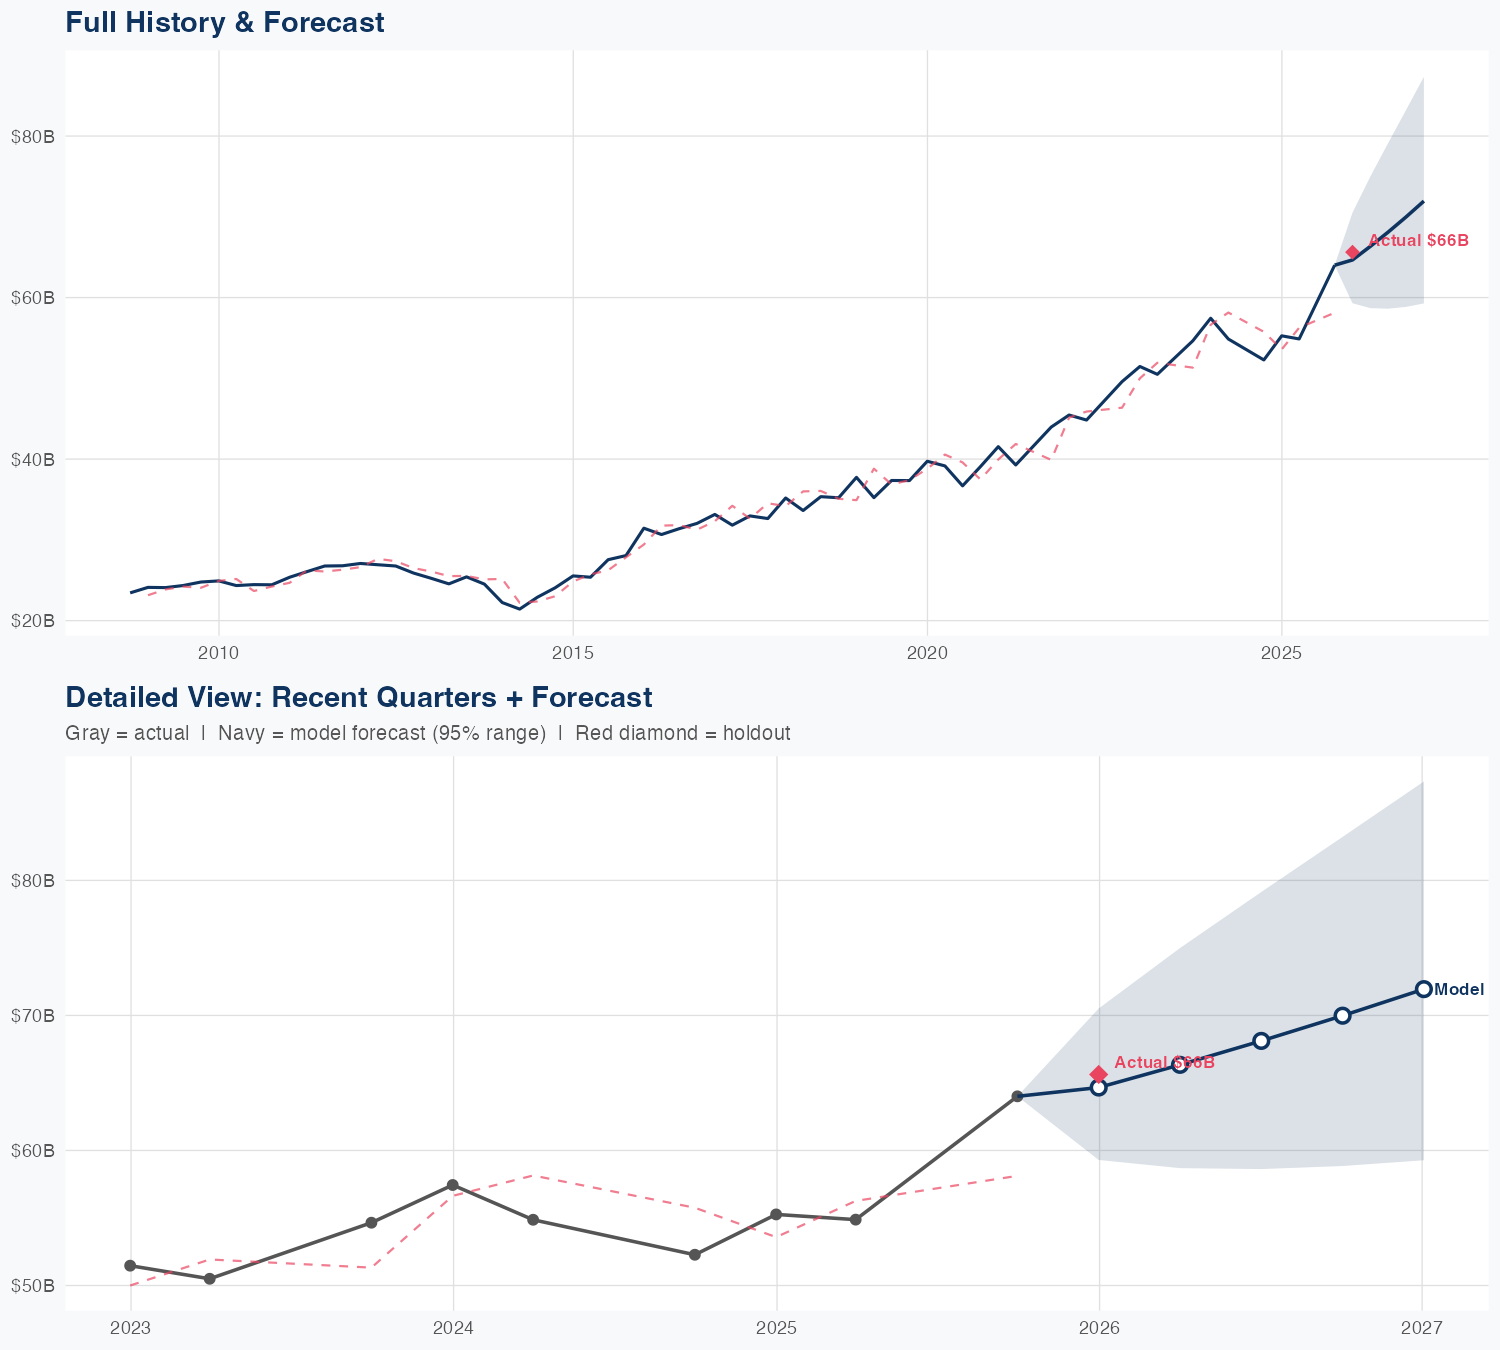
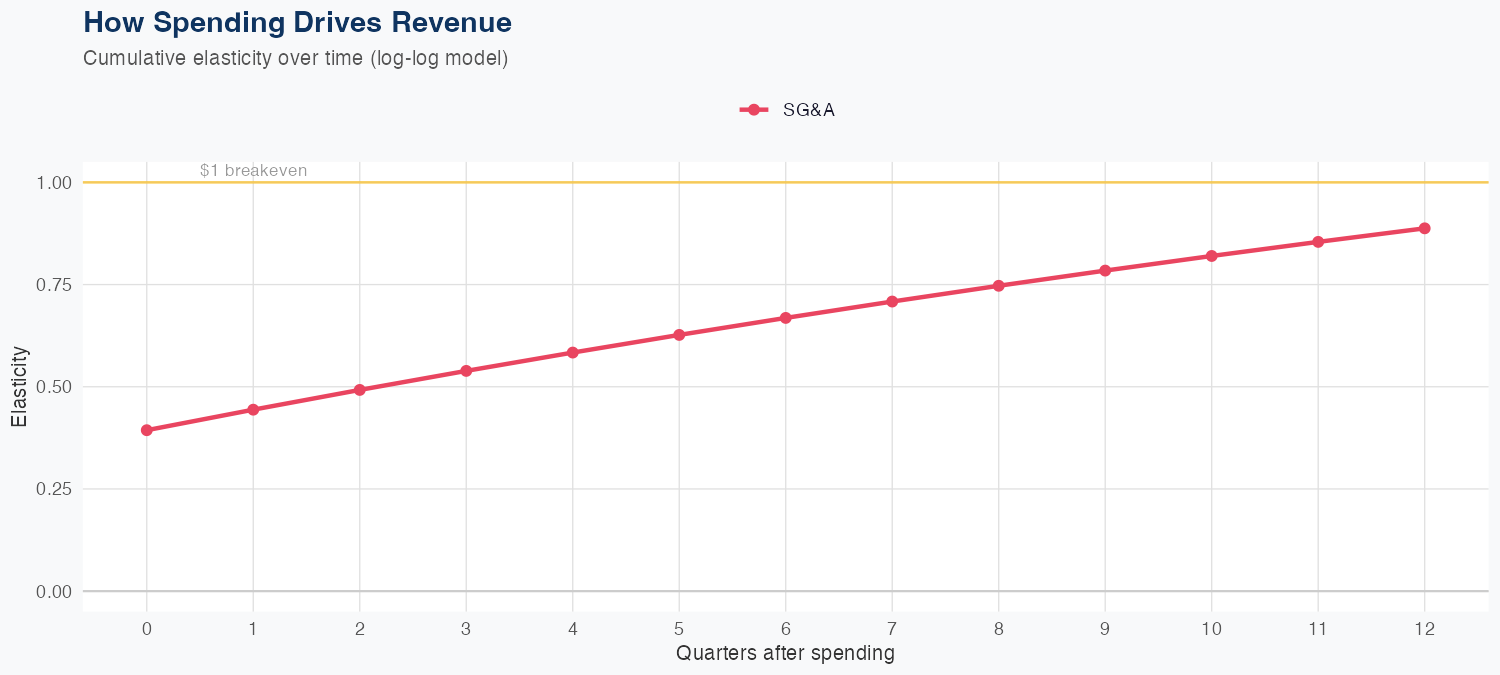
Our econometric model shows Cardinal Health is delivering meaningful top-line growth with operating leverage: SG&A elasticity is 0.89x, so SG&A expands slower than revenue, suggesting most growth comes from volume and mix rather than fatiguing selling costs. The holdout test for SG&A produced 64.7B vs 65.6B actual, a -1.5% miss, and overall MAPE of 3.5% across 65 quarters, implying the forecast is reasonably reliable but with a modest bias toward underpredicting costs as activity climbs. This means margin resilience should hold if growth remains productively channeled into higher-margin services rather than heavier SG&A push, though acquisitions or payer/pricing headwinds could erode that leverage. Key risks to watch are regulatory/pricing shifts, volume volatility in pharma distribution, and integration costs from any M&A-driven growth.
Investment Thesis
The econometric model achieves strong accuracy (3.5% MAPE), suggesting Cardinal Health, Inc.'s revenue trajectory is well-characterized by its spending patterns. Sales & marketing spend shows a 0.89x elasticity, suggesting effective go-to-market execution.
Revenue Forecast
Quarterly Detail
| Quarter | Model Forecast | Actual | 95% Range | YoY Growth | Status |
|---|---|---|---|---|---|
| Q4 2025 | $65B | $66B | $59B – $71B | +23.7% | ✓ In range |
| Q2 2026 | $66B | $59B – $75B | +20.0% | ||
| Q3 2026 | $68B | $59B – $79B | +24.1% | ||
| Q4 2026 | $70B | $59B – $83B | +9.3% | ||
| Q1 2027 | $72B | $59B – $87B | +9.6% |
Seasonal Factors
| Fiscal Quarter | Seasonal Factor | vs Trend | Interpretation | Obs. |
|---|---|---|---|---|
| FQ1 (Sep–Nov) | 1.0185 | +1.8% | In line with trend | 17 |
| FQ2 (Dec–Feb) | 1.0276 | +2.8% | In line with trend | 18 |
| FQ3 (Mar–May) | 0.9654 | -3.5% | -3.5% below trend | 17 |
| FQ4 (Jun–Aug) | 1.0104 | +1.0% | In line with trend | 12 |
How Spending Drives Revenue
Want this analysis for your portfolio?
I build custom revenue intelligence reports for investors and companies using SEC filing data, econometric modeling, and AI-powered insights.
Get in Touch