Cdw Corp CDW
Revenue Intelligence Report • 62 quarters of SEC filing data • Updated 2026-03-15
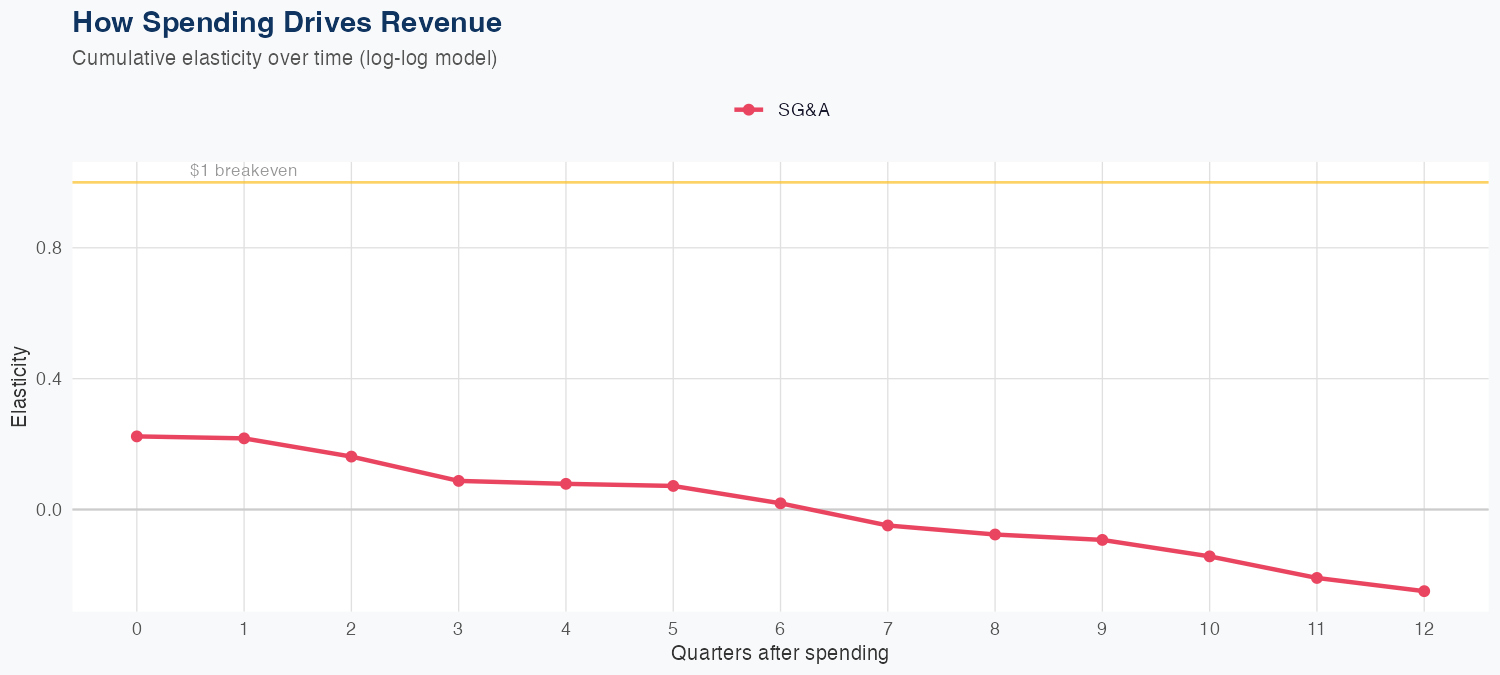
The latest quarterly revenue came in at $5.511 billion. In the log-log model, SG&A spending has a negative revenue elasticity of about -0.24 per 1% SG&A increase, implying modestly negative ROI on SG&A growth unless offset by margin gains or other revenue drivers. The model shows solid accuracy with a 3.9% MAPE and a holdout error of 4.0% (predicted $5.3B vs actual $5.5B) based on 62 quarters of data. For the full year, revenue is forecast around $22B, down 1.2% year over year, signaling a cautious near-term outlook where SG&A efficiency and other growth levers will be central to sustaining momentum.
Investment Thesis
The econometric model achieves strong accuracy (3.9% MAPE), suggesting Cdw Corp's revenue trajectory is well-characterized by its spending patterns.
Revenue Forecast
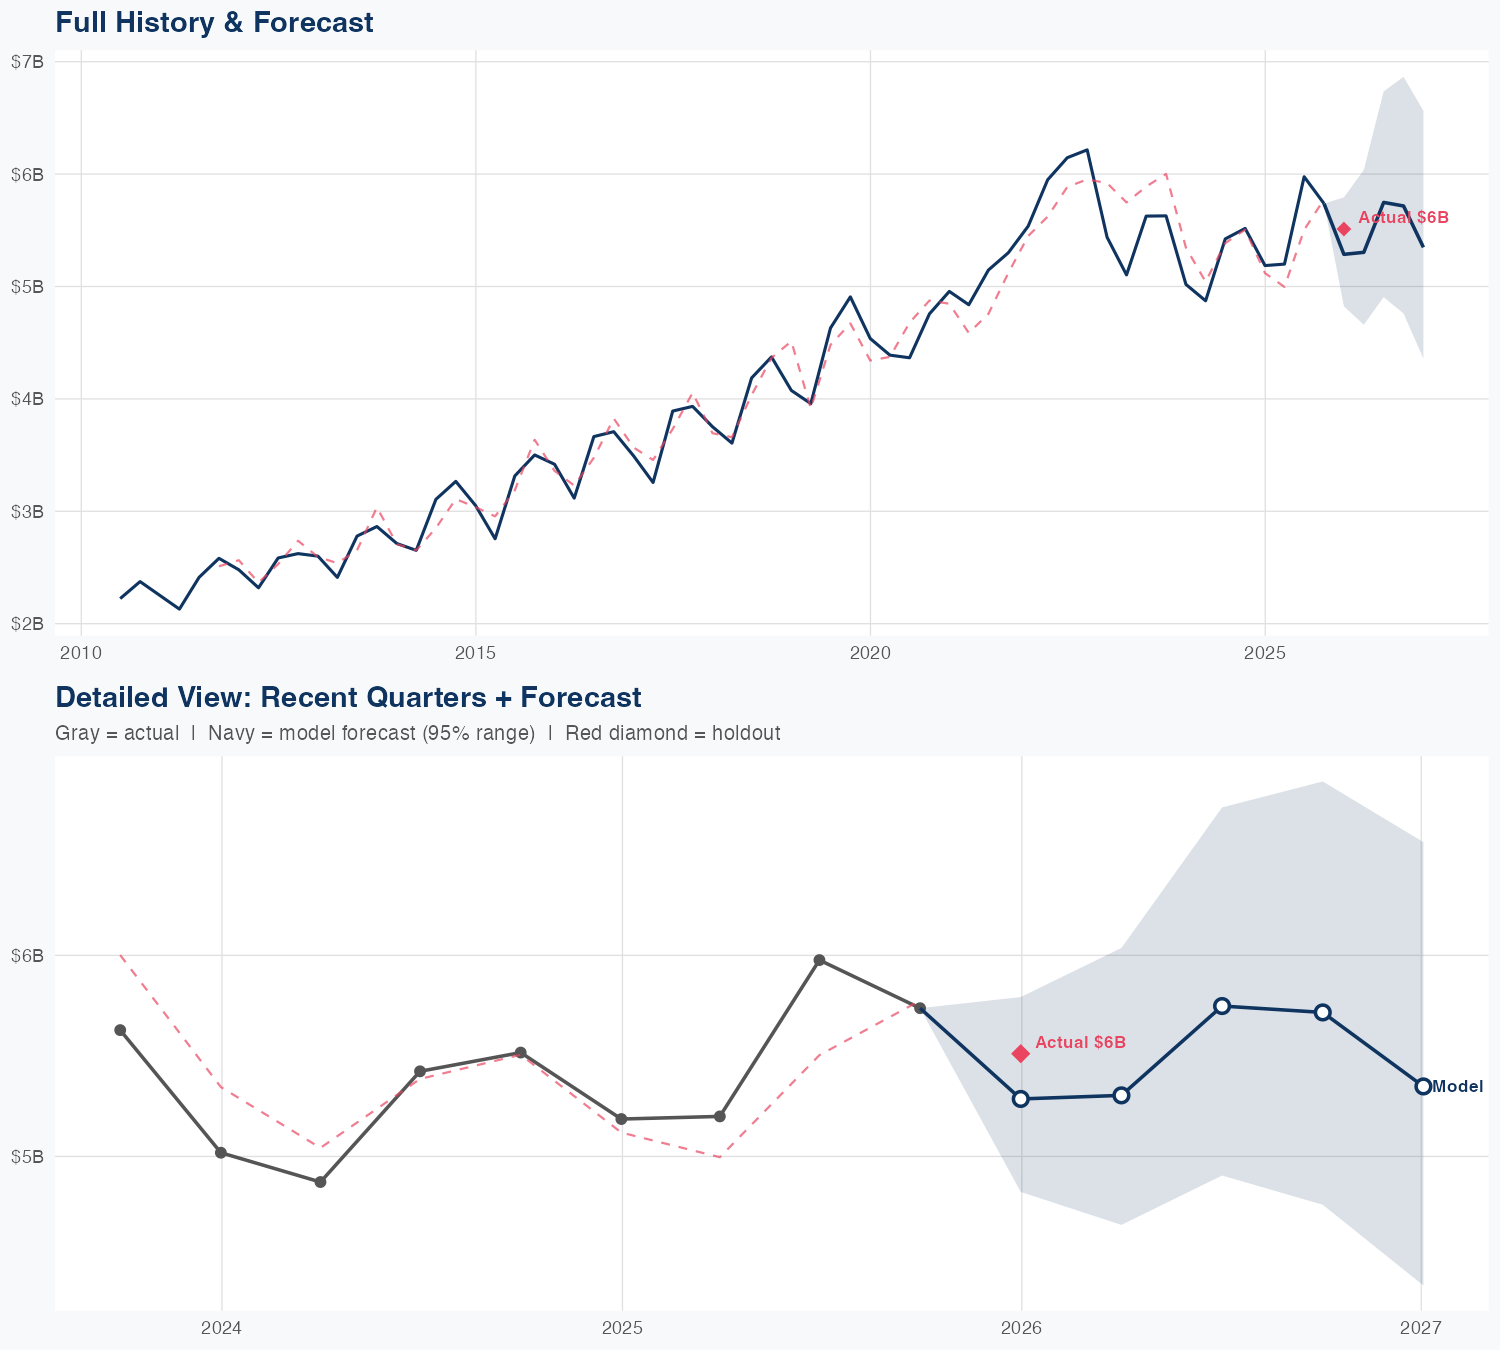
Quarterly Detail
| Quarter | Model Forecast | Actual | 95% Range | YoY Growth | Status |
|---|---|---|---|---|---|
| Q4 2025 | $5.3B | $5.5B | $4.8B – $5.8B | +2.0% | ✓ In range |
| Q2 2026 | $5.3B | $4.7B – $6.1B | +2.2% | ||
| Q3 2026 | $5.8B | $4.9B – $6.8B | -3.8% | ||
| Q4 2026 | $5.7B | $4.8B – $6.9B | -0.3% | ||
| Q1 2027 | $5.4B | $4.4B – $6.6B | -2.7% |
Seasonal Factors
| Fiscal Quarter | Seasonal Factor | vs Trend | Interpretation | Obs. |
|---|---|---|---|---|
| FQ1 (Sep–Nov) | 0.9865 | -1.4% | In line with trend | 15 |
| FQ2 (Dec–Feb) | 1.0047 | +0.5% | In line with trend | 15 |
| FQ3 (Mar–May) | 0.9786 | -2.1% | In line with trend | 14 |
| FQ4 (Jun–Aug) | 1.0456 | +4.6% | +4.6% above trend | 14 |
How Spending Drives Revenue
Want this analysis for your portfolio?
I build custom revenue intelligence reports for investors and companies using SEC filing data, econometric modeling, and AI-powered insights.
Get in Touch