The Cooper Companies, Inc. COO
Revenue Intelligence Report • 50 quarters of SEC filing data • Updated 2026-03-15
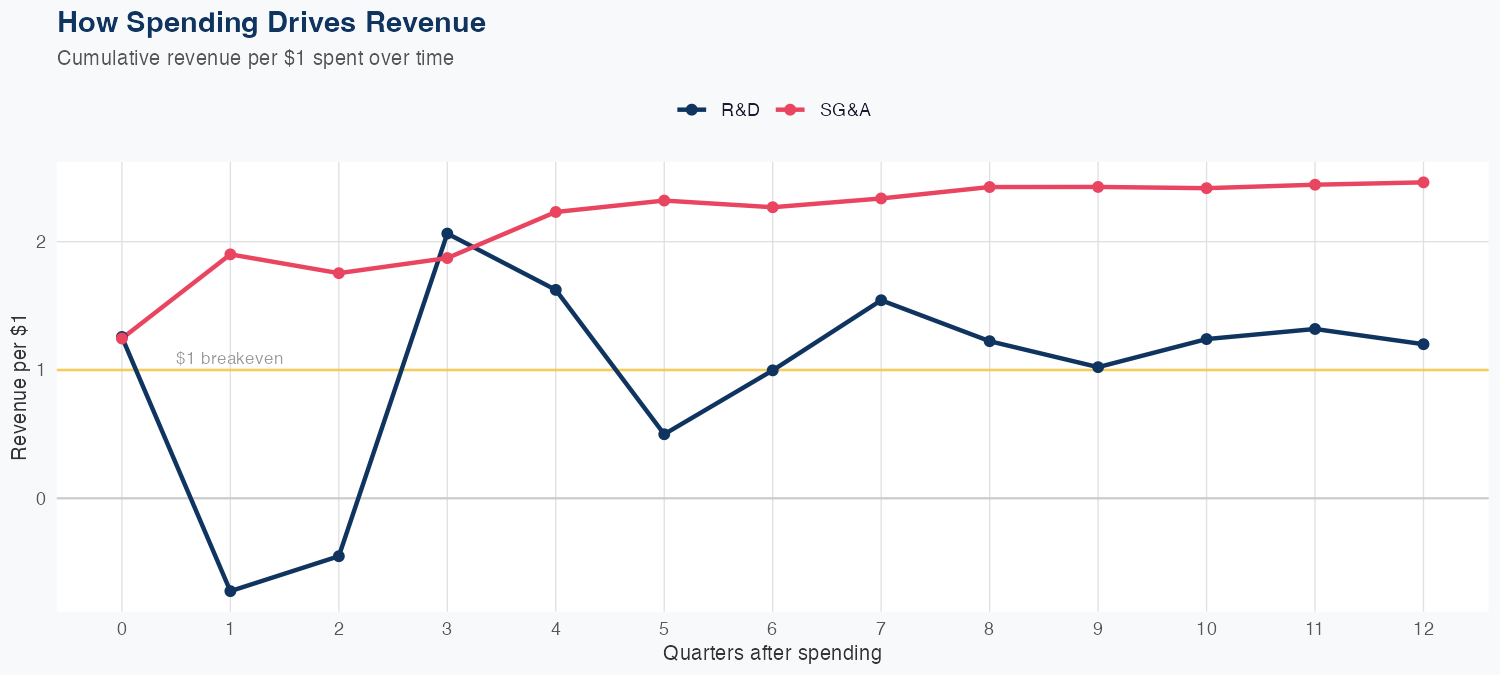
Revenue growth is driven by SG&A efficiency, as each dollar of SG&A spending is modeled to generate $2.46 in long-run revenue, compared with $0.75 from R&D investments. The model uses 50 quarters of data and shows 2.8% MAPE, with a holdout test yielding predicted $1.0B versus actual $1.0B (−2.5% error), indicating solid predictive reliability. The latest quarterly revenue is $1.024B, and the FY forecast is $4.2B, up about 3.8% year over year. Investors can expect SG&A-driven upside to remain a meaningful revenue driver, supported by a data-backed, modest but durable growth outlook.
Investment Thesis
Our ARDL model tracks The Cooper Companies, Inc.'s revenue with exceptional precision (2.8% MAPE), indicating highly predictable cash flows. Every $1 of R&D investment is associated with $0.75 of revenue, indicating efficient capital deployment in innovation. Each $1 of SG&A spending generates $2.46 in revenue, reflecting strong commercial efficiency.
Revenue Forecast
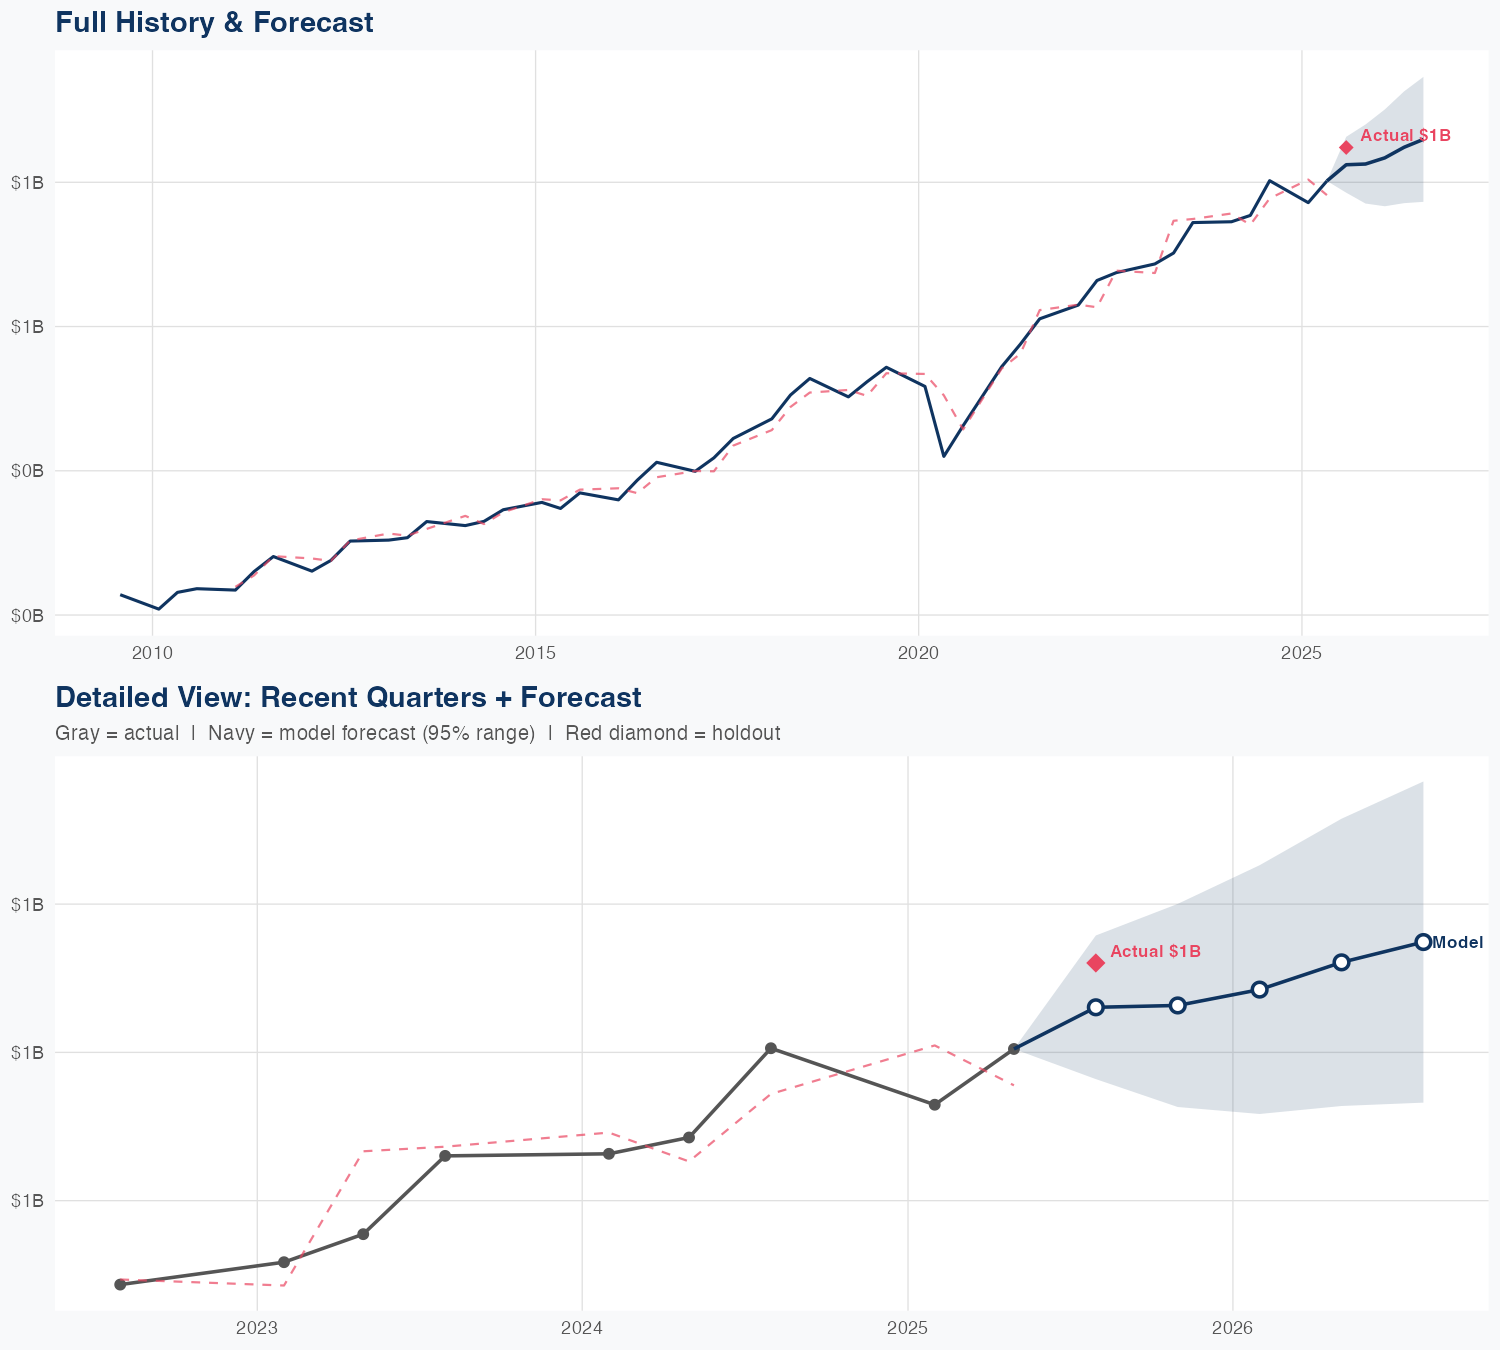
Quarterly Detail
| Quarter | Model Forecast | Actual | 95% Range | YoY Growth | Status |
|---|---|---|---|---|---|
| Q4 2025 | $1.0B | $1.0B | $1.0B – $1.1B | +4.6% | ✓ In range |
| Q1 2026 | $1.0B | $1.0B – $1.1B | +6.6% | ||
| Q2 2026 | $1.0B | $1.0B – $1.1B | +4.1% | ||
| Q3 2026 | $1.1B | $1.0B – $1.2B | +0.7% | ||
| Q4 2026 | $1.1B | $1.0B – $1.2B | +4.2% |
Seasonal Factors
| Fiscal Quarter | Seasonal Factor | vs Trend | Interpretation | Obs. |
|---|---|---|---|---|
| FQ1 (Sep–Nov) | 1.0 | +0.0% | In line with trend | 0 |
| FQ2 (Dec–Feb) | 0.9841 | -1.6% | In line with trend | 16 |
| FQ3 (Mar–May) | 1.0186 | +1.9% | In line with trend | 15 |
| FQ4 (Jun–Aug) | 1.0096 | +1.0% | In line with trend | 15 |
How Spending Drives Revenue
Want this analysis for your portfolio?
I build custom revenue intelligence reports for investors and companies using SEC filing data, econometric modeling, and AI-powered insights.
Get in Touch