Cencora, Inc. COR
Revenue Intelligence Report • 58 quarters of SEC filing data • Updated 2026-03-15
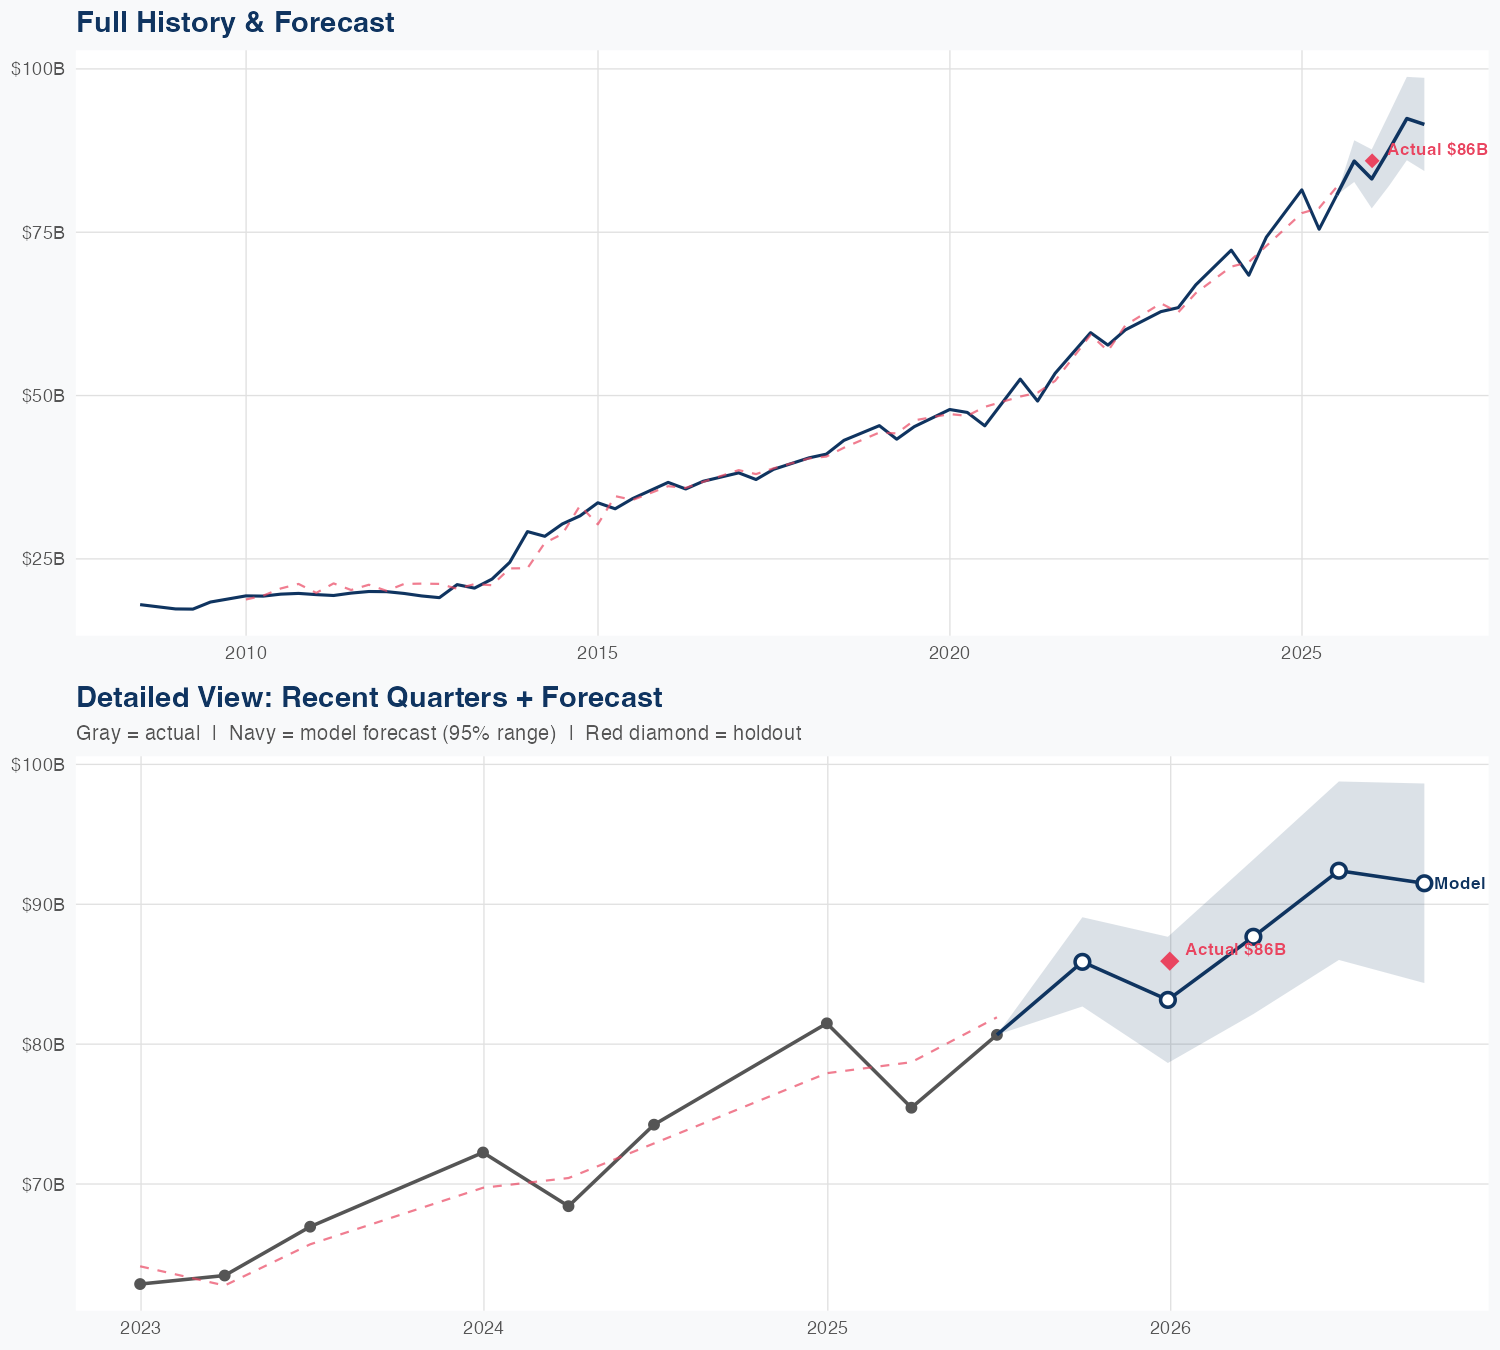
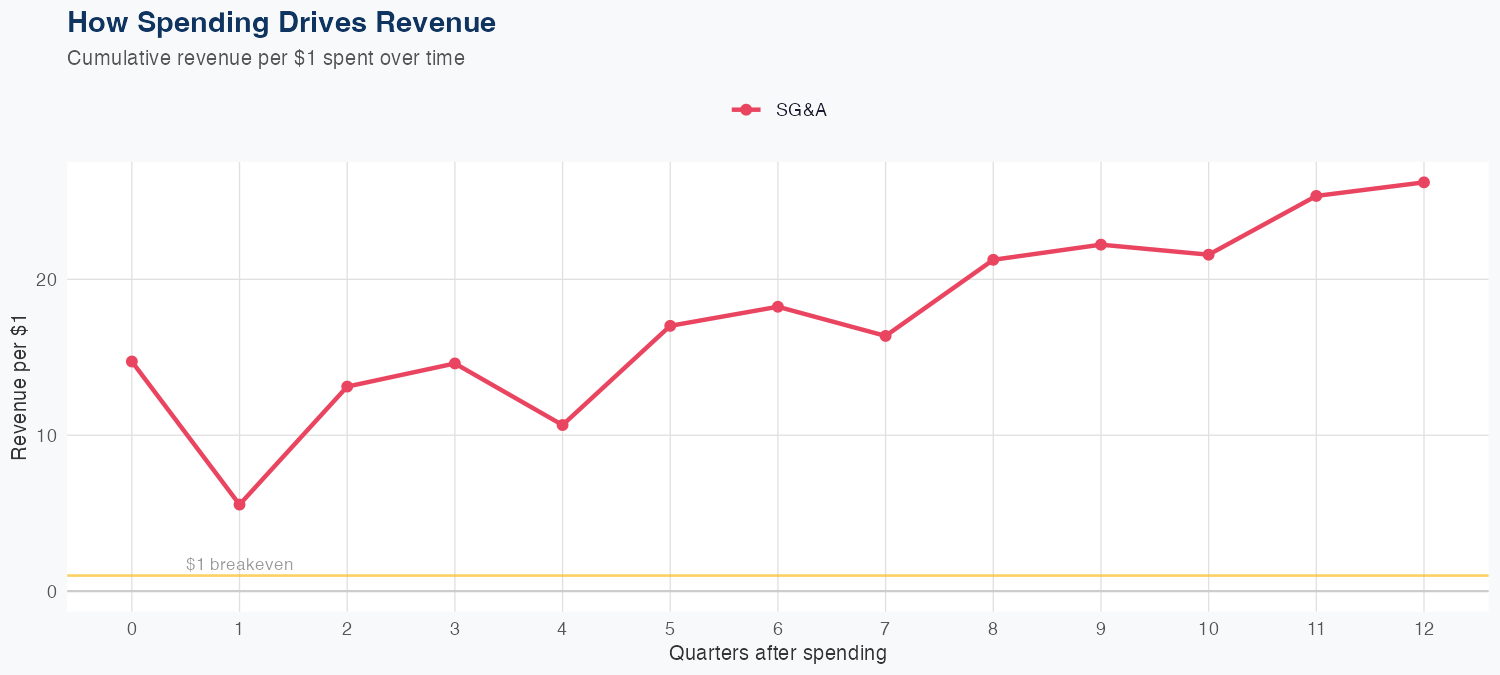
In our econometric model, COR’s FY revenue growth of 9.6% sits atop an operating structure where SG&A efficiency translates into outsized revenue leverage, evidenced by SG&A ROI of $26.22 per $1 spent. This elasticity suggests incremental SG&A spend—covering sales, marketing, and logistics—drives growth through volume gains and network coverage rather than material price or R&D push, fitting a capital-light, distribution model. The holdout test is exceptionally reliable: predicted $85.9B vs actual $85.9B with about -0.1% error, and a 3.5% MAPE over 58 quarters underscores forecast robustness. Risks to this growth pace include sensitivity to supply-chain disruptions, payer negotiations, and regulatory shifts that could erode margins if volumes or pricing power deteriorate.
Investment Thesis
The econometric model achieves strong accuracy (3.5% MAPE), suggesting Cencora, Inc.'s revenue trajectory is well-characterized by its spending patterns. Each $1 of SG&A spending generates $26.22 in revenue, reflecting strong commercial efficiency.
Revenue Forecast
Quarterly Detail
| Quarter | Model Forecast | Actual | 95% Range | YoY Growth | Status |
|---|---|---|---|---|---|
| Q3 2025 | $86B | $86B | $83B – $89B | +15.7% | ✓ In range |
| Q4 2025 | $83B | $79B – $88B | +2.1% | ||
| Q1 2026 | $88B | $82B – $93B | +16.2% | ||
| Q2 2026 | $92B | $86B – $99B | +14.5% | ||
| Q3 2026 | $92B | $84B – $99B | +6.5% |
Seasonal Factors
| Fiscal Quarter | Seasonal Factor | vs Trend | Interpretation | Obs. |
|---|---|---|---|---|
| FQ1 (Sep–Nov) | 0.9509 | -4.9% | -4.9% below trend | 5 |
| FQ2 (Dec–Feb) | 1.0161 | +1.6% | In line with trend | 17 |
| FQ3 (Mar–May) | 0.98 | -2.0% | In line with trend | 16 |
| FQ4 (Jun–Aug) | 1.0025 | +0.2% | In line with trend | 16 |
How Spending Drives Revenue
Want this analysis for your portfolio?
I build custom revenue intelligence reports for investors and companies using SEC filing data, econometric modeling, and AI-powered insights.
Get in Touch