Edwards Lifesciences Corporation EW
Revenue Intelligence Report • 66 quarters of SEC filing data • Updated 2026-03-15
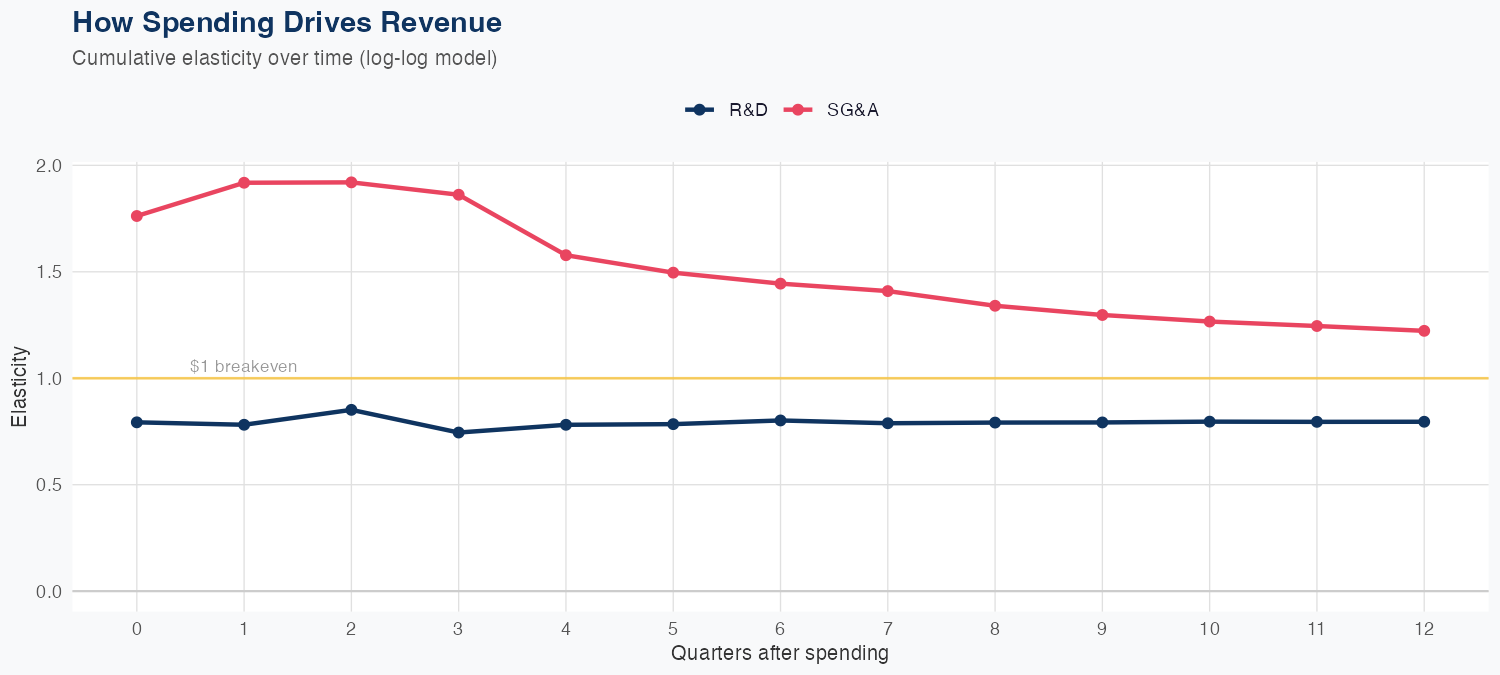
The revenue model shows SG&A spending has higher revenue elasticity than R&D, with a 1% increase in SG&A associated with a 1.22% revenue lift versus 0.80% for 1% R&D, indicating SG&A investments currently yield stronger revenue leverage. The 66-quarter log-log model delivers a 4.3% MAPE and, in a holdout test, predicted $1.6B against actual $1.6B with a -0.8% error, underscoring forecast reliability. The FY outlook calls for about $7.1B in revenue, up roughly 16.5% year over year, signaling solid top-line momentum. Investors should note that while SG&A offers greater revenue leverage than R&D, net ROI depends on margins and operating efficiency, but the overall outlook remains favorable given disciplined spending and strong growth trajectory.
Investment Thesis
The econometric model achieves strong accuracy (4.3% MAPE), suggesting Edwards Lifesciences Corporation's revenue trajectory is well-characterized by its spending patterns. R&D investment shows a 0.80x multiplier — each 1% increase in R&D spend is associated with a 0.80% revenue increase, signaling strong innovation-to-revenue conversion. Sales & marketing spend shows a 1.22x elasticity, suggesting effective go-to-market execution.
Revenue Forecast
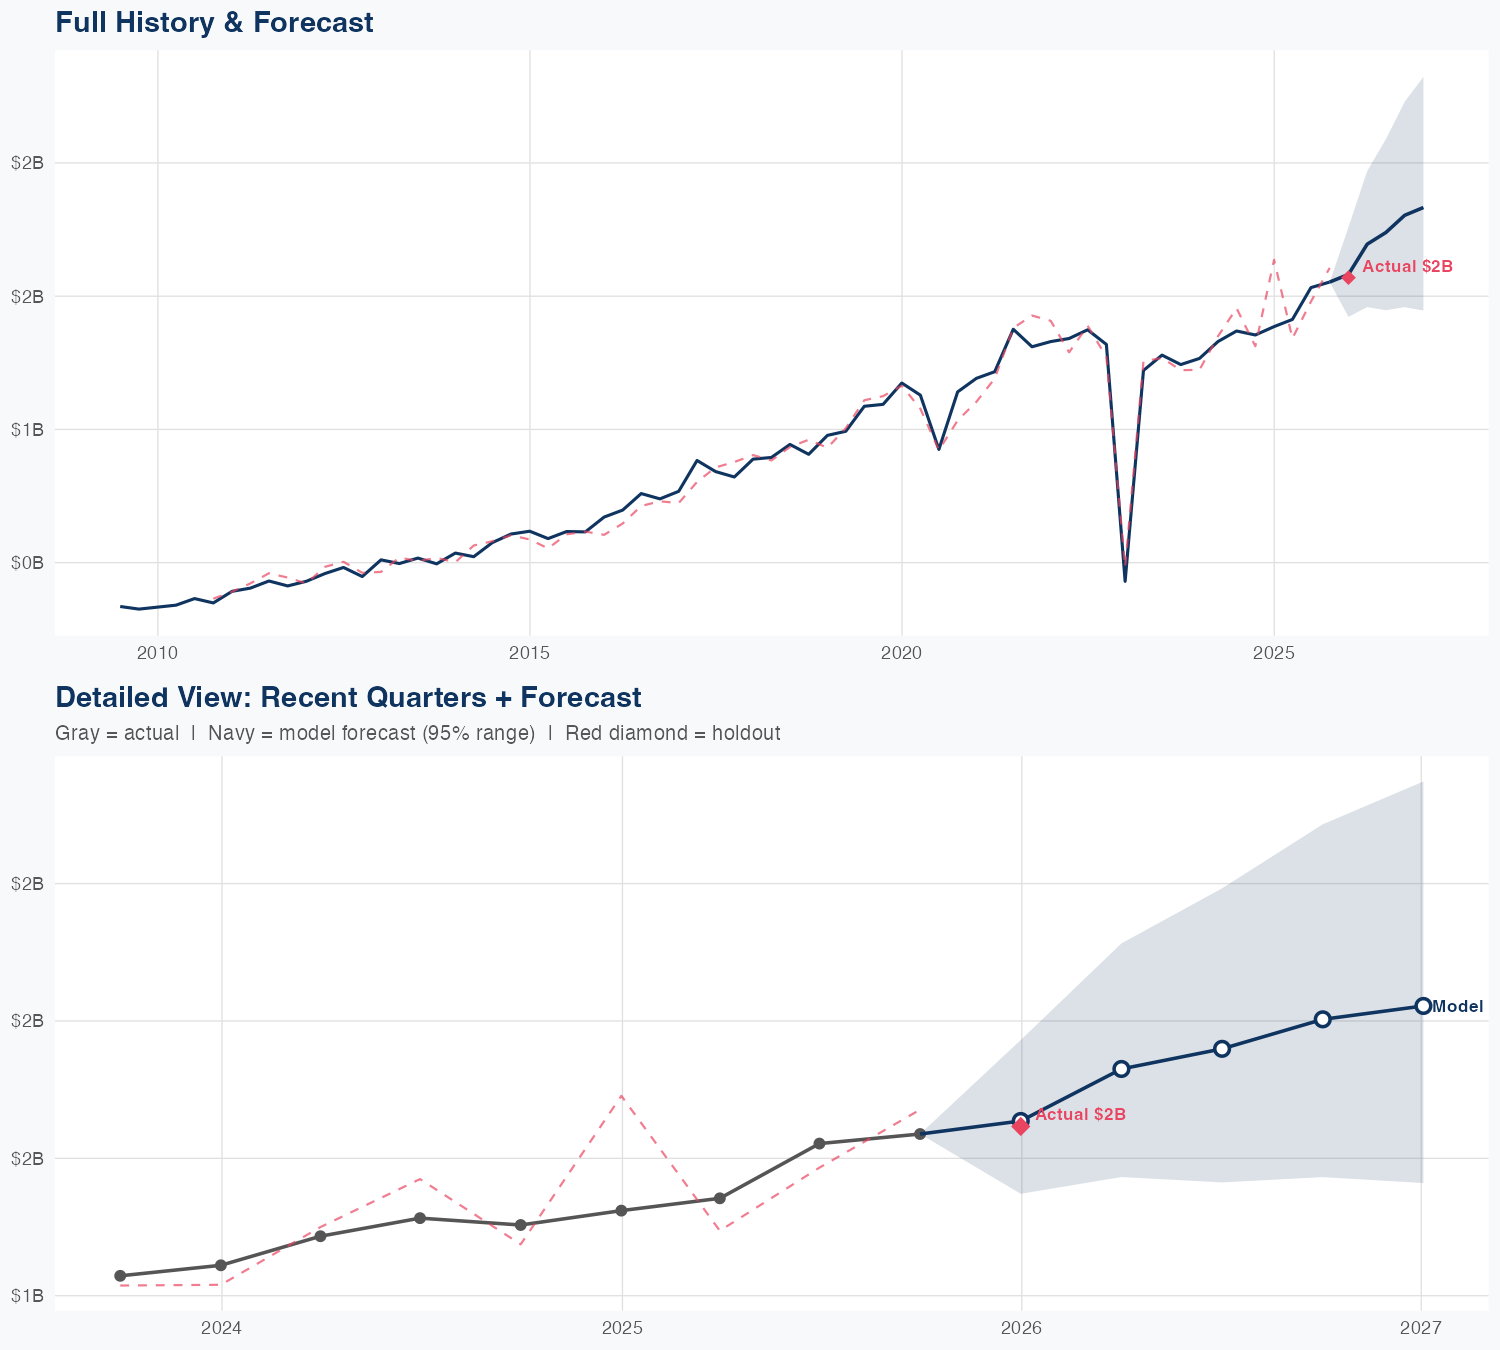
Quarterly Detail
| Quarter | Model Forecast | Actual | 95% Range | YoY Growth | Status |
|---|---|---|---|---|---|
| Q4 2025 | $1.6B | $1.6B | $1.4B – $1.8B | +14.1% | ✓ In range |
| Q2 2026 | $1.7B | $1.5B – $2.0B | +20.0% | ||
| Q3 2026 | $1.7B | $1.4B – $2.1B | +13.5% | ||
| Q4 2026 | $1.8B | $1.5B – $2.2B | +16.1% | ||
| Q1 2027 | $1.8B | $1.4B – $2.3B | +16.8% |
Seasonal Factors
| Fiscal Quarter | Seasonal Factor | vs Trend | Interpretation | Obs. |
|---|---|---|---|---|
| FQ1 (Sep–Nov) | 0.9725 | -2.7% | In line with trend | 16 |
| FQ2 (Dec–Feb) | 1.0348 | +3.5% | +3.5% above trend | 16 |
| FQ3 (Mar–May) | 1.0126 | +1.3% | In line with trend | 15 |
| FQ4 (Jun–Aug) | 0.9967 | -0.3% | In line with trend | 15 |
How Spending Drives Revenue
Want this analysis for your portfolio?
I build custom revenue intelligence reports for investors and companies using SEC filing data, econometric modeling, and AI-powered insights.
Get in Touch