First Solar, Inc. FSLR
Revenue Intelligence Report • 64 quarters of SEC filing data • Updated 2026-03-15
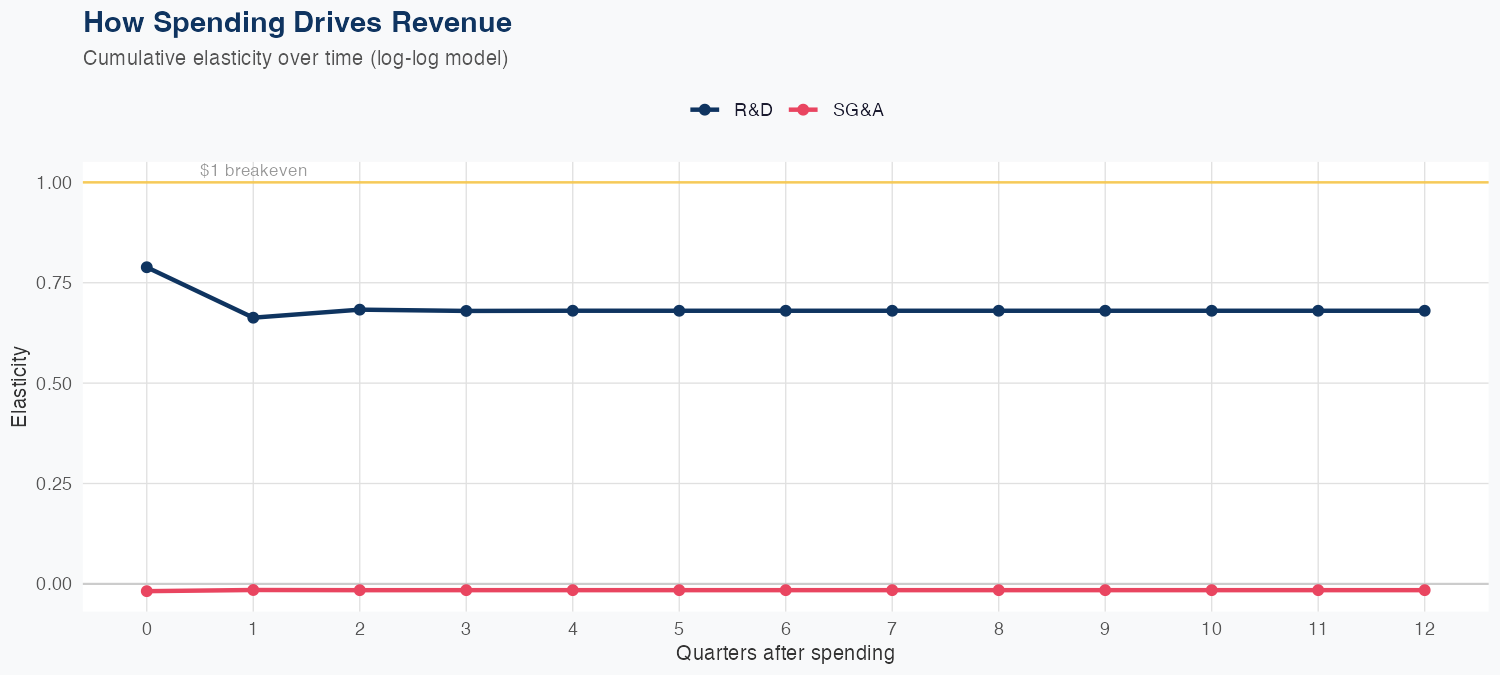
Revenue is most sensitive to R&D spending, with a 1% increase in R&D driving about a 0.68% rise in revenue, while SG&A has a near-flat to slightly negative effect of about -0.02% per 1% SG&A increase. The model’s log-log framework implies meaningful ROI on R&D, but predictive accuracy is limited, with a 26.4% MAPE and a holdout forecast error where a predicted $1.2B undershot actual revenue of $1.7B by 31.5%. The FY revenue forecast is about $5.2B, down 0.3% year over year, signaling only modest top-line momentum unless R&D-driven demand accelerates. Investors should focus on the ROI of R&D as a growth driver, weigh the forecast uncertainty against potential upside from targeted innovation, and view SG&A containment as offering limited relief given its minimal revenue impact.
Investment Thesis
At 26.4% MAPE, the model captures First Solar, Inc.'s broad revenue trajectory, though quarterly variability suggests sensitivity to external factors. R&D investment shows a 0.68x multiplier — each 1% increase in R&D spend is associated with a 0.68% revenue increase, signaling strong innovation-to-revenue conversion.
Revenue Forecast
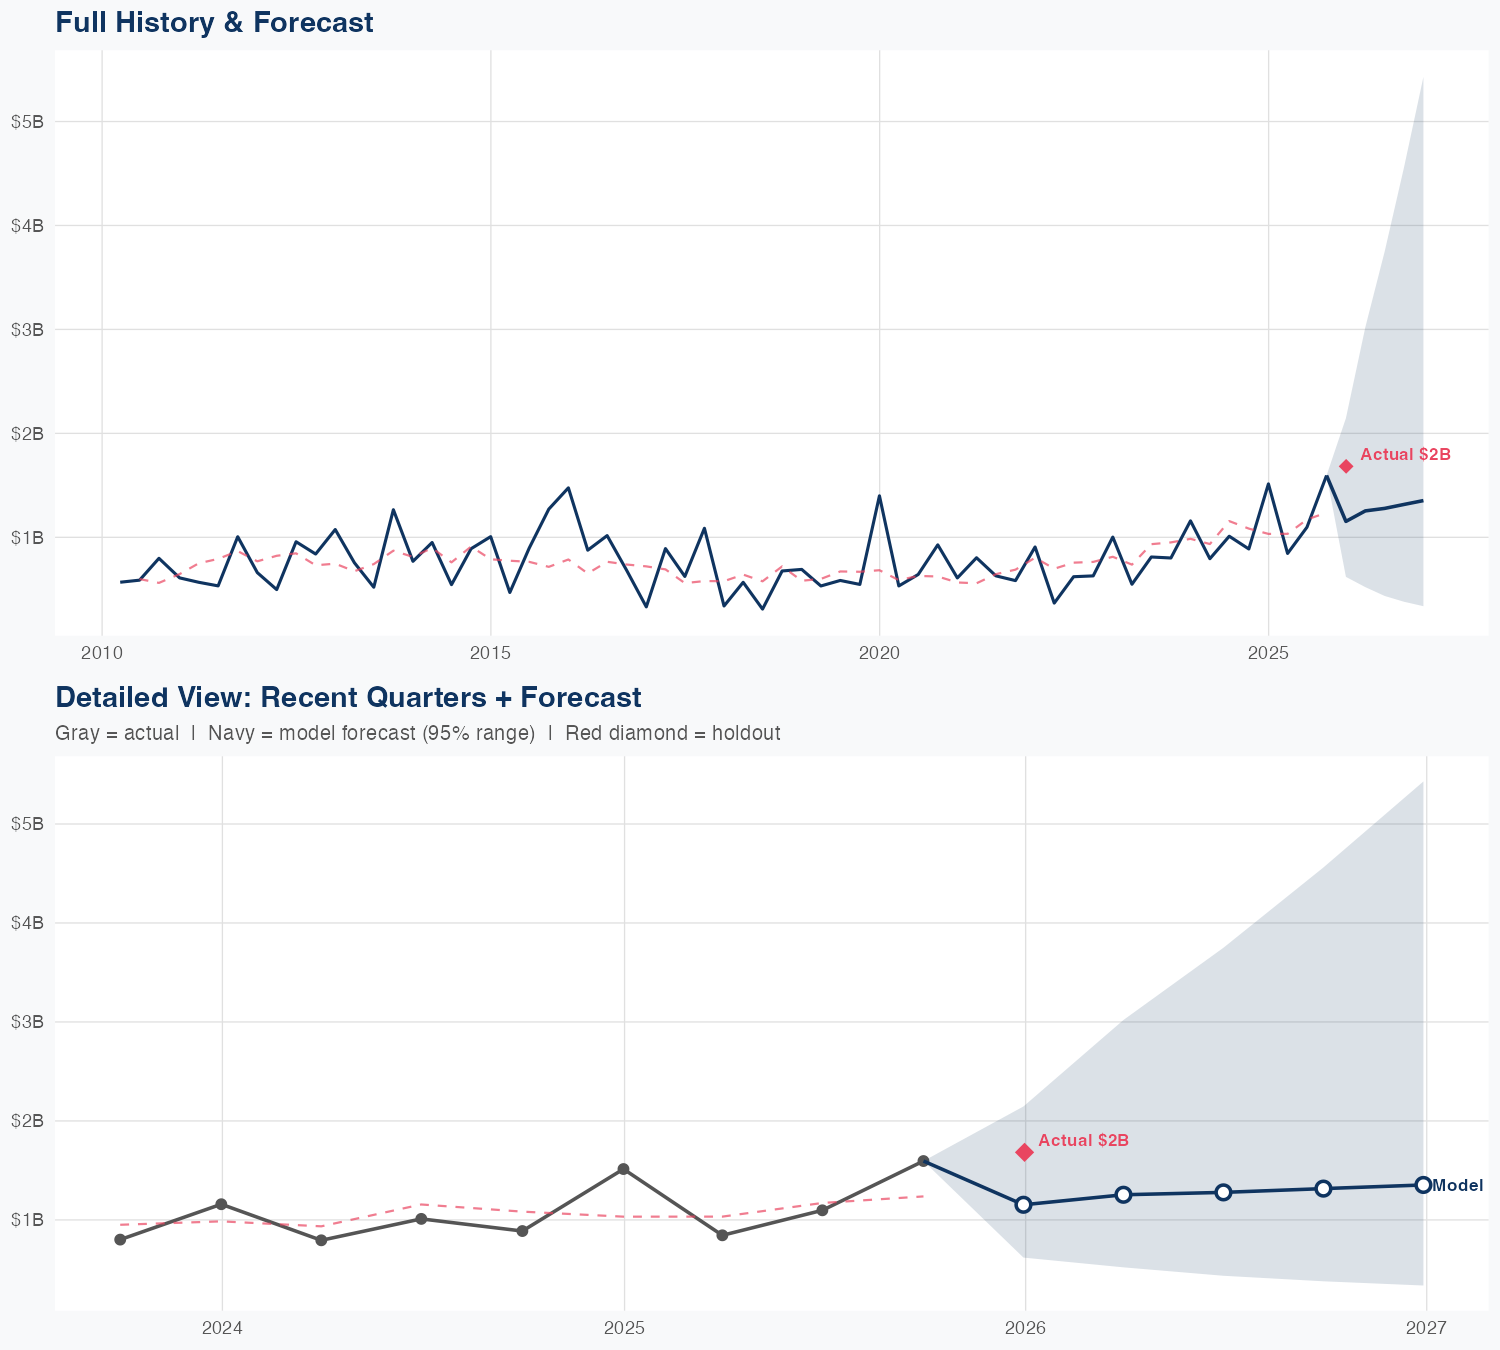
Quarterly Detail
| Quarter | Model Forecast | Actual | 95% Range | YoY Growth | Status |
|---|---|---|---|---|---|
| Q4 2025 | $1.2B | $1.7B | $0.6B – $2.1B | -23.8% | ✓ In range |
| Q1 2026 | $1.3B | $0.5B – $3.0B | +48.5% | ||
| Q2 2026 | $1.3B | $0.4B – $3.7B | +16.5% | ||
| Q3 2026 | $1.3B | $0.4B – $4.6B | -17.5% | ||
| Q4 2026 | $1.4B | $0.3B – $5.4B | -19.6% |
Seasonal Factors
| Fiscal Quarter | Seasonal Factor | vs Trend | Interpretation | Obs. |
|---|---|---|---|---|
| FQ1 (Sep–Nov) | 1.1479 | +14.8% | +14.8% above trend | 16 |
| FQ2 (Dec–Feb) | 1.1873 | +18.7% | +18.7% above trend | 16 |
| FQ3 (Mar–May) | 0.8845 | -11.5% | -11.5% below trend | 15 |
| FQ4 (Jun–Aug) | 0.9367 | -6.3% | -6.3% below trend | 16 |
How Spending Drives Revenue
Want this analysis for your portfolio?
I build custom revenue intelligence reports for investors and companies using SEC filing data, econometric modeling, and AI-powered insights.
Get in Touch