Alphabet Inc. GOOG
Revenue Intelligence Report • 44 quarters of SEC filing data • Updated 2026-03-15
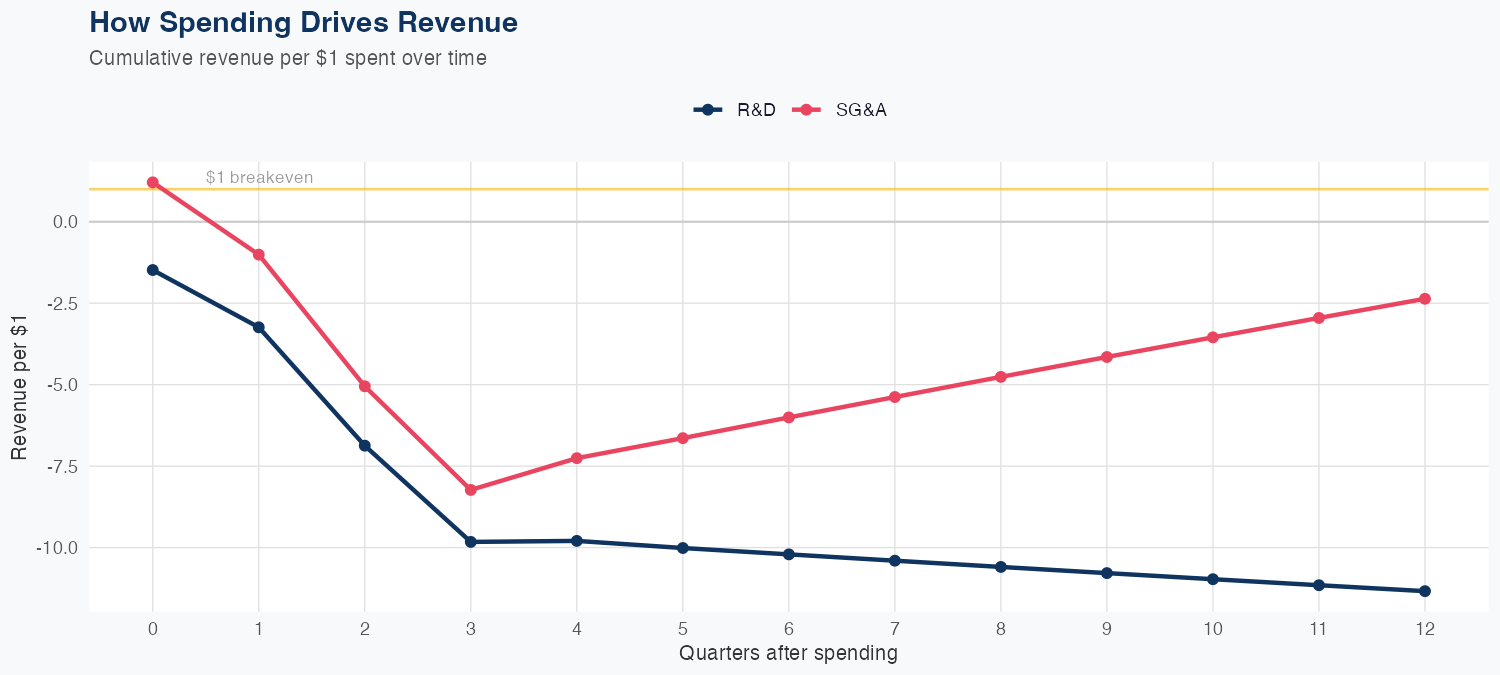
Alphabet generated about $391B in revenue, up 1.5% YoY, and our econometric model (log form, 44 quarters) fits well with a 2.9% MAPE, suggesting the structure is reliable but not perfect. The elasticities tell a clear story: R&D at 0.44x implies spending on research contributes to revenue growth, but only modestly, perhaps reflecting the mature core businesses and lagged benefits from new AI features; SG&A at 0.83x is a stronger lever, indicating go-to-market, monetization, and platform investments drive more reliable revenue uplift. The holdout miss—$93B predicted vs $102B actual, a -9.1% error—highlights out-of-sample forecast risk and potential regime shifts, possibly from AI-enabled monetization or ad-cycle dynamics. Overall, growth looks more dependent on monetization efficiency and SG&A leverage than on R&D a priori, exposing Alphabet to ad spend cycles, regulatory and competitive pressures in AI, YouTube, and Cloud if the growth pace dissipates.
Investment Thesis
Our ARDL model tracks Alphabet Inc.'s revenue with exceptional precision (2.9% MAPE), indicating highly predictable cash flows. R&D investment shows a 0.44x multiplier — each 1% increase in R&D spend is associated with a 0.44% revenue increase, signaling strong innovation-to-revenue conversion. Sales & marketing spend shows a 0.83x elasticity, suggesting effective go-to-market execution.
Revenue Forecast
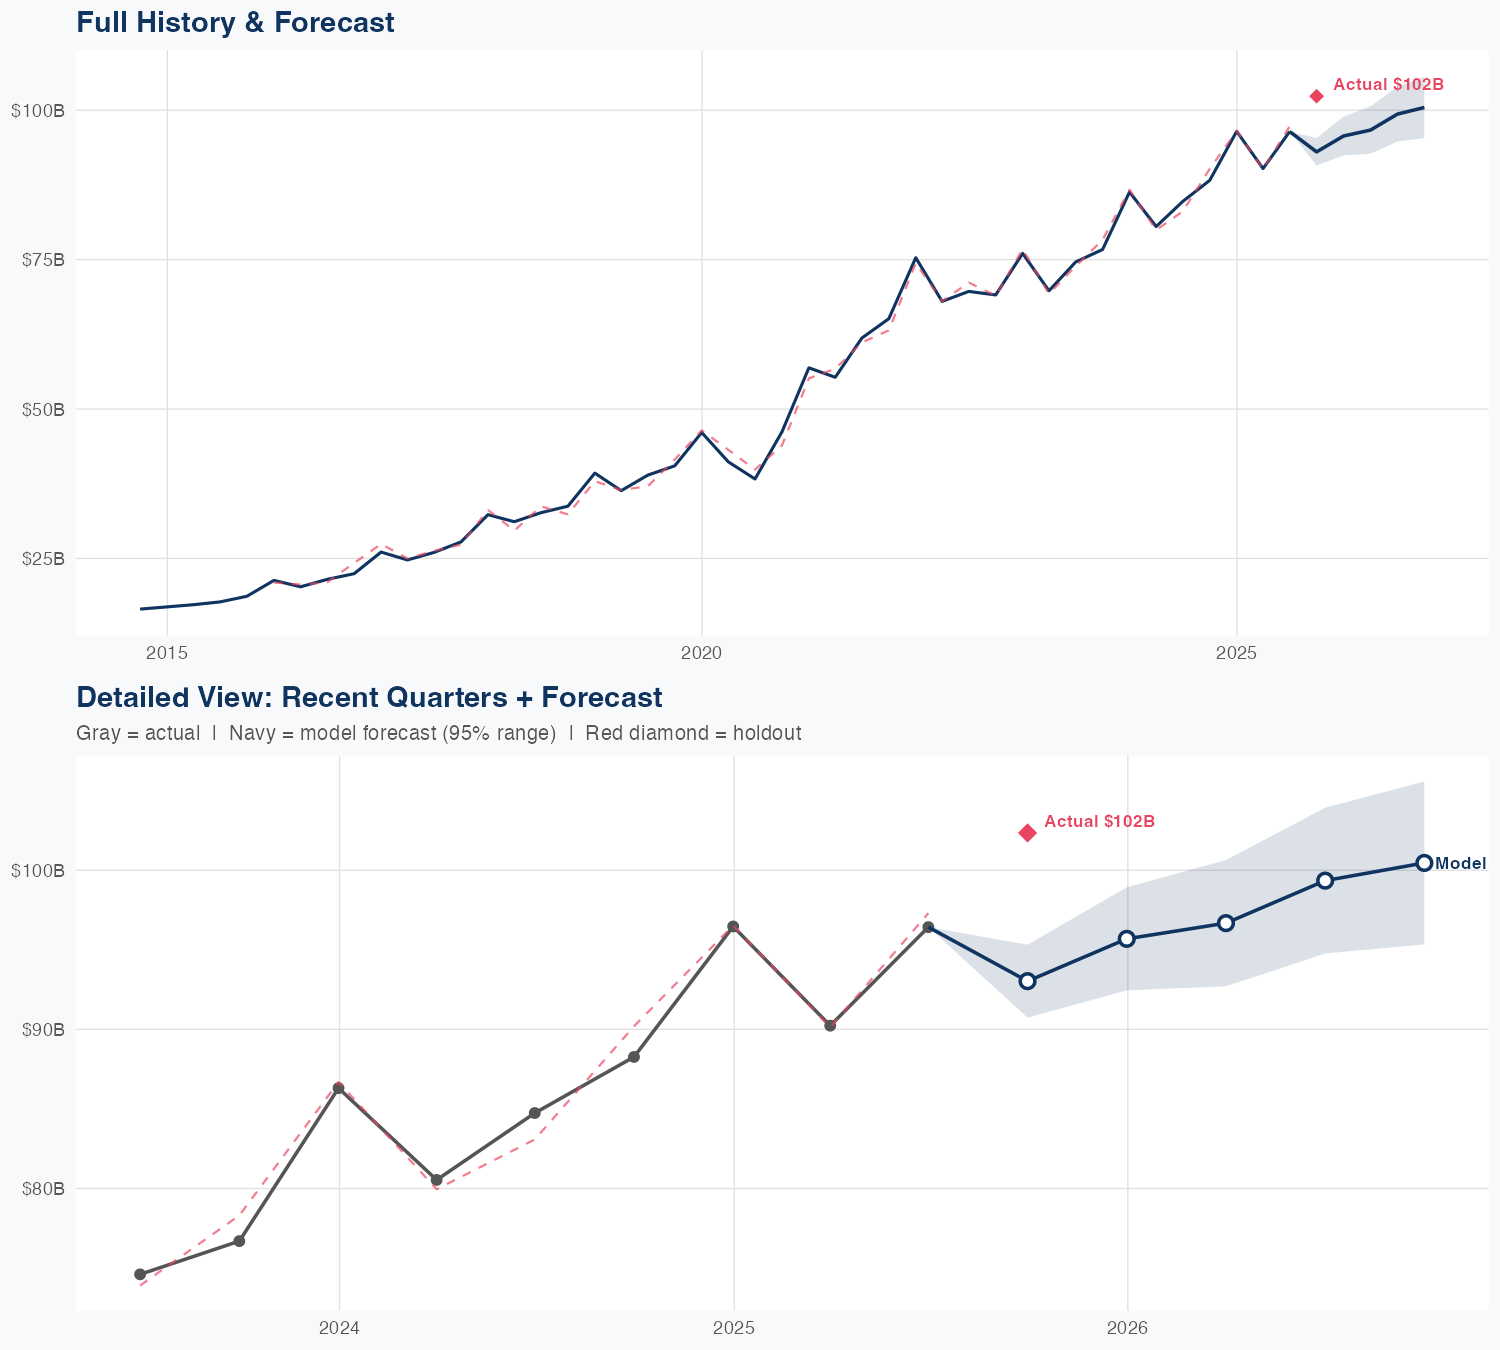
Quarterly Detail
| Quarter | Model Forecast | Actual | 95% Range | YoY Growth | Status |
|---|---|---|---|---|---|
| Q3 2025 | $93B | $102B | $86B – $100B | +5.4% | ✗ Outside range |
| Q4 2025 | $95B | $85B – $106B | -1.6% | ||
| Q2 2026 | $97B | $85B – $111B | +7.3% | ||
| Q3 2026 | $99B | $85B – $115B | +2.4% | ||
| Q4 2026 | $101B | $85B – $120B | -1.6% |
Seasonal Factors
| Fiscal Quarter | Seasonal Factor | vs Trend | Interpretation | Obs. |
|---|---|---|---|---|
| FQ1 (Sep–Nov) | 0.9848 | -1.5% | In line with trend | 11 |
| FQ2 (Dec–Feb) | 1.0131 | +1.3% | In line with trend | 10 |
| FQ3 (Mar–May) | 0.9864 | -1.4% | In line with trend | 11 |
| FQ4 (Jun–Aug) | 1.0064 | +0.6% | In line with trend | 11 |
How Spending Drives Revenue
Want this analysis for your portfolio?
I build custom revenue intelligence reports for investors and companies using SEC filing data, econometric modeling, and AI-powered insights.
Get in Touch