Genuine Parts Co GPC
Revenue Intelligence Report • 36 quarters of SEC filing data • Updated 2026-03-15
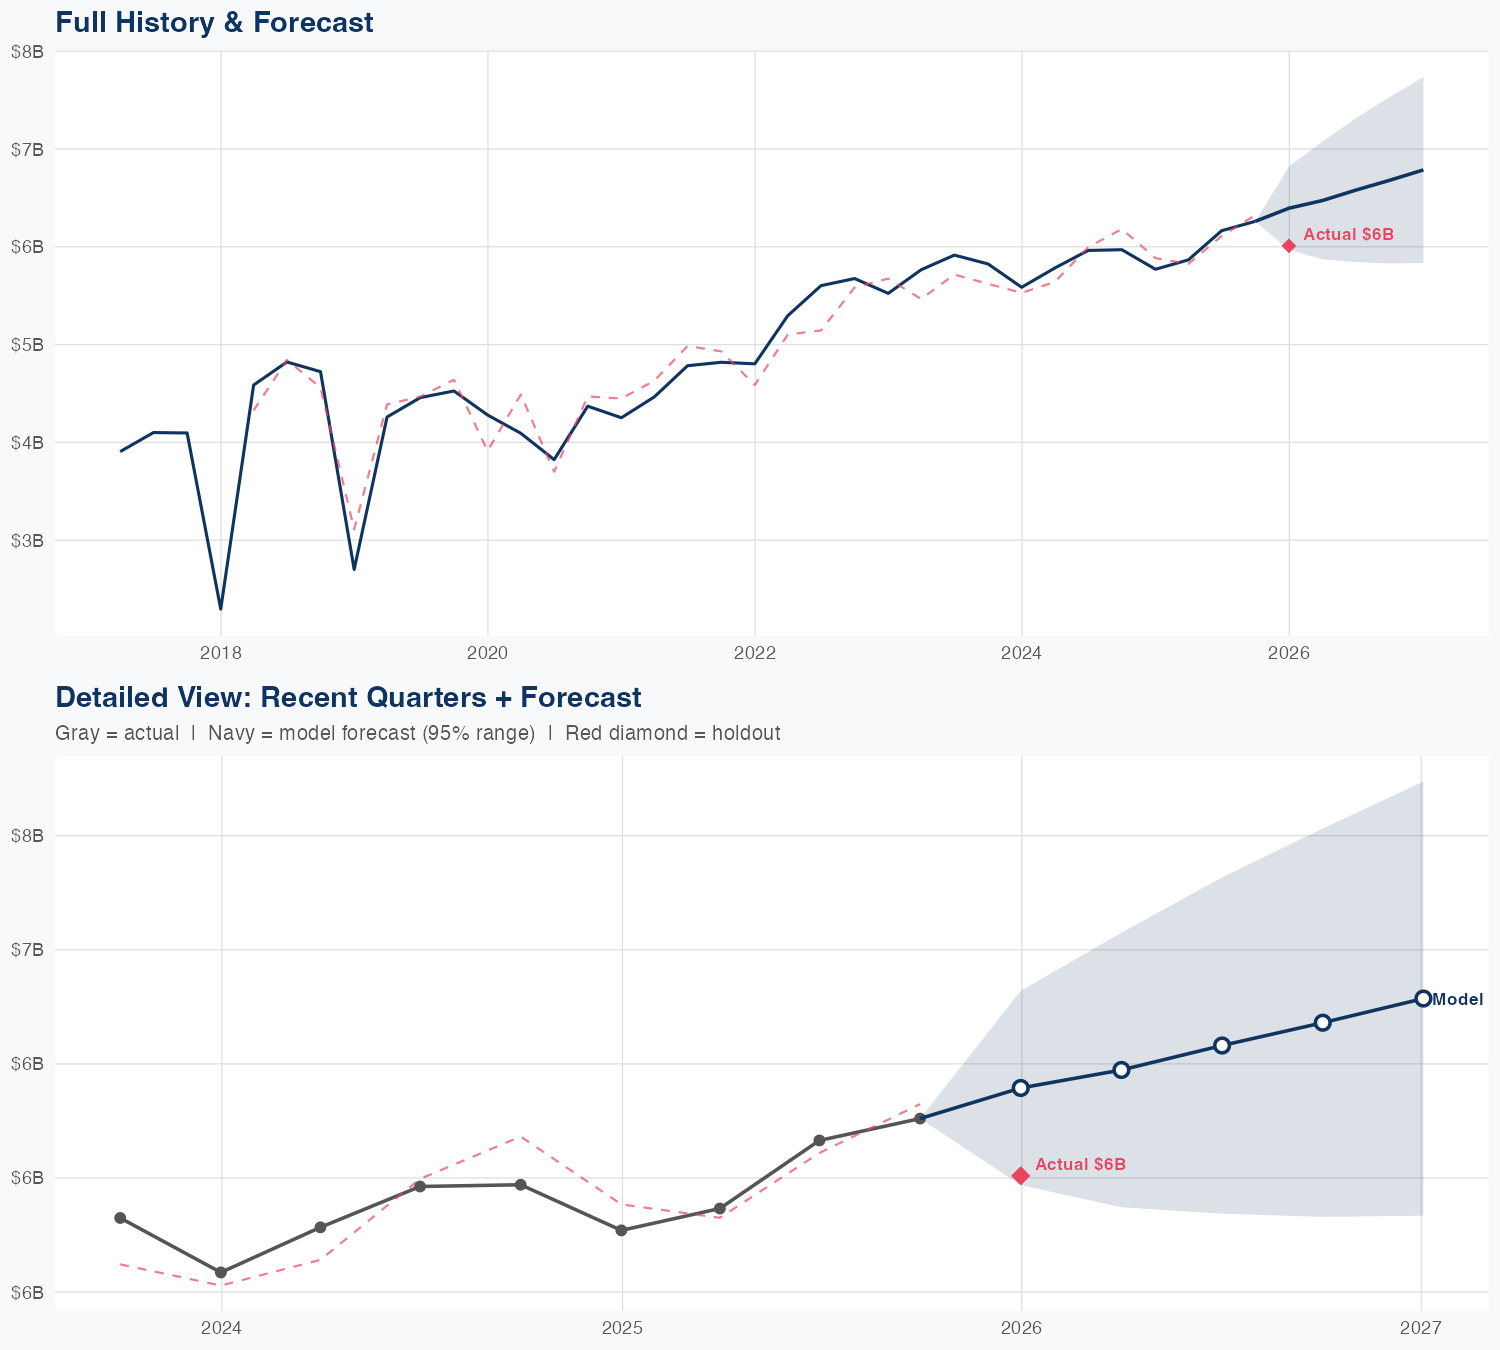
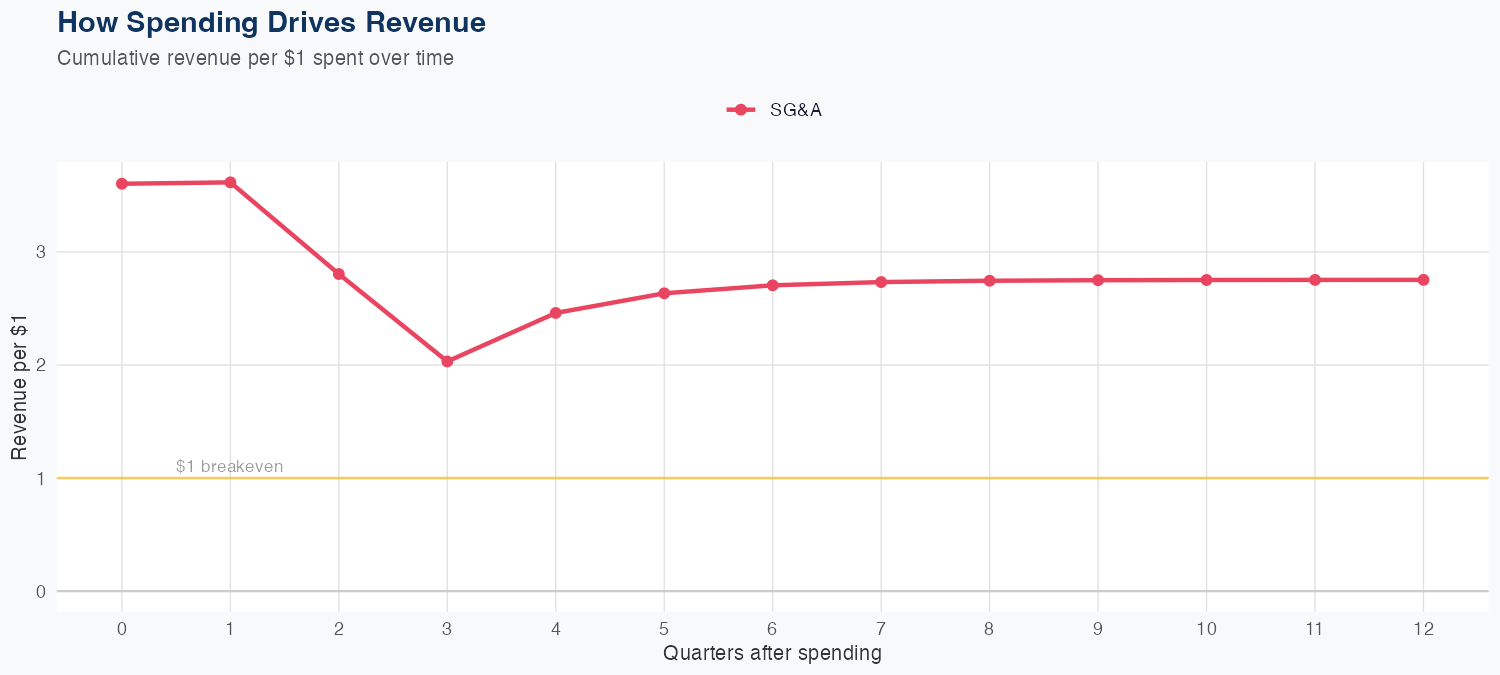
Revenue growth is driven primarily by SG&A efficiency, with a linear model implying that every $1 of SG&A spending generates $2.75 in long-run revenue, signaling strong ROI from operating expenses. The model uses 36 quarters of data and achieves 3.8% MAPE, with a holdout forecast of $6.4B vs actual $6.0B (about a 6.4% overprediction), indicating reasonable accuracy with a modest bias. The latest quarterly revenue runs around $6.0B, while the full-year forecast is about $27B, representing roughly 9% year-over-year growth and ongoing top-line momentum. The outlook remains constructive if SG&A efficiency persists, though investors should monitor spend effectiveness and broader competitive dynamics, especially given the absence of R&D data.
Investment Thesis
The econometric model achieves strong accuracy (3.8% MAPE), suggesting Genuine Parts Co's revenue trajectory is well-characterized by its spending patterns. Each $1 of SG&A spending generates $2.75 in revenue, reflecting strong commercial efficiency.
Revenue Forecast
Quarterly Detail
| Quarter | Model Forecast | Actual | 95% Range | YoY Growth | Status |
|---|---|---|---|---|---|
| Q4 2025 | $6.4B | $6.0B | $6.0B – $6.8B | +10.8% | ✓ In range |
| Q2 2026 | $6.5B | $5.9B – $7.1B | +10.4% | ||
| Q3 2026 | $6.6B | $5.8B – $7.3B | +6.7% | ||
| Q4 2026 | $6.7B | $5.8B – $7.5B | +6.7% | ||
| Q1 2027 | $6.8B | $5.8B – $7.7B | +12.9% |
Seasonal Factors
| Fiscal Quarter | Seasonal Factor | vs Trend | Interpretation | Obs. |
|---|---|---|---|---|
| FQ1 (Sep–Nov) | 0.99 | -1.0% | In line with trend | 8 |
| FQ2 (Dec–Feb) | 0.9806 | -1.9% | In line with trend | 8 |
| FQ3 (Mar–May) | 1.0253 | +2.5% | In line with trend | 8 |
| FQ4 (Jun–Aug) | 1.009 | +0.9% | In line with trend | 8 |
How Spending Drives Revenue
Want this analysis for your portfolio?
I build custom revenue intelligence reports for investors and companies using SEC filing data, econometric modeling, and AI-powered insights.
Get in Touch