International Flavors & Fragrances Inc IFF
Revenue Intelligence Report • 34 quarters of SEC filing data • Updated 2026-03-15
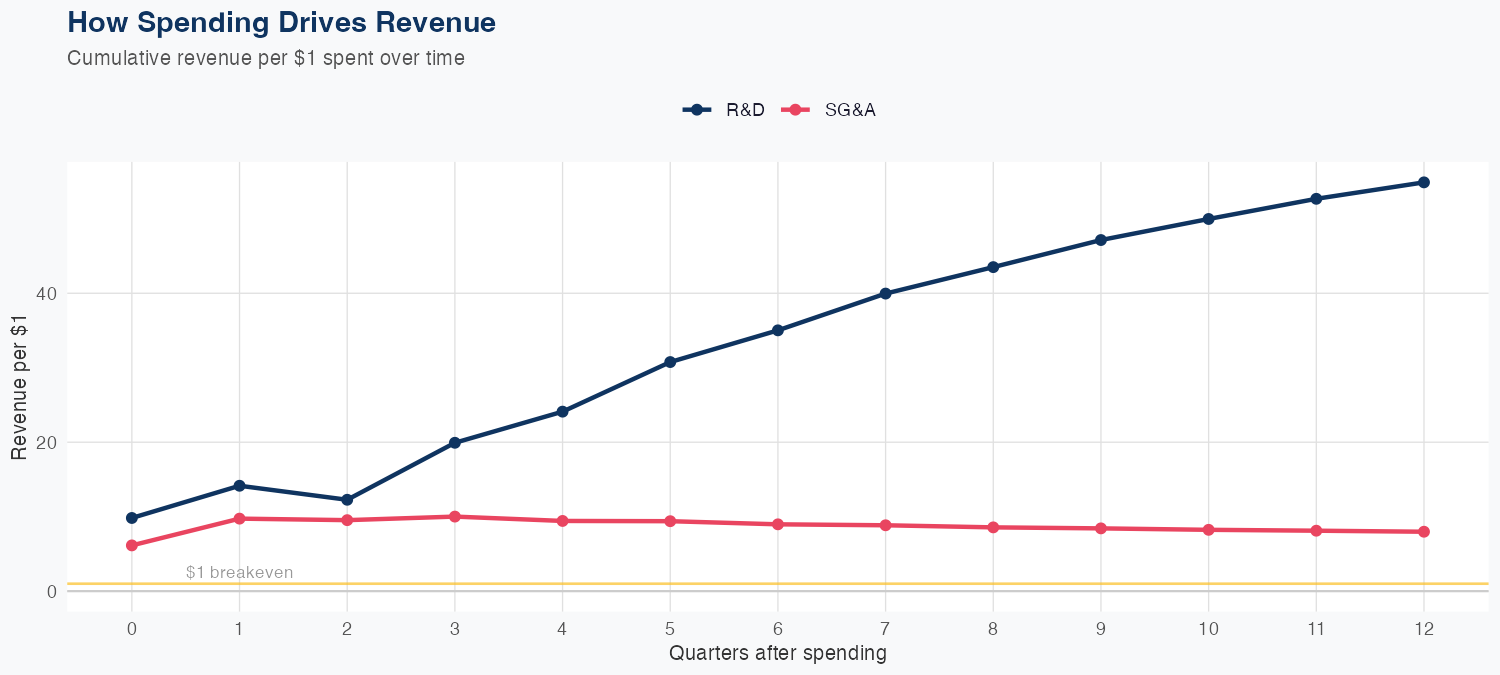
Revenue is driven by high ROI from R&D investments, with every $1 of R&D spending associated with about $54.89 of long-run revenue, compared with $7.98 per $1 of SG&A. A linear model built on 34 quarters of data yields strong predictive accuracy (3.0% MAPE) and a holdout test error of 0.6%, and the latest quarterly revenue came in at $2.589B. The FY forecast calls for approximately $12B in revenue, up 11.7% year over year, underscoring the scale and efficiency of the growth engine. Overall, the outlook remains favorable, with R&D-driven revenue growth supported by disciplined SG&A and a credible model-based forecast.
Investment Thesis
The econometric model achieves strong accuracy (3.0% MAPE), suggesting International Flavors & Fragrances Inc's revenue trajectory is well-characterized by its spending patterns. Every $1 of R&D investment is associated with $54.89 of revenue, indicating efficient capital deployment in innovation. Each $1 of SG&A spending generates $7.98 in revenue, reflecting strong commercial efficiency.
Revenue Forecast
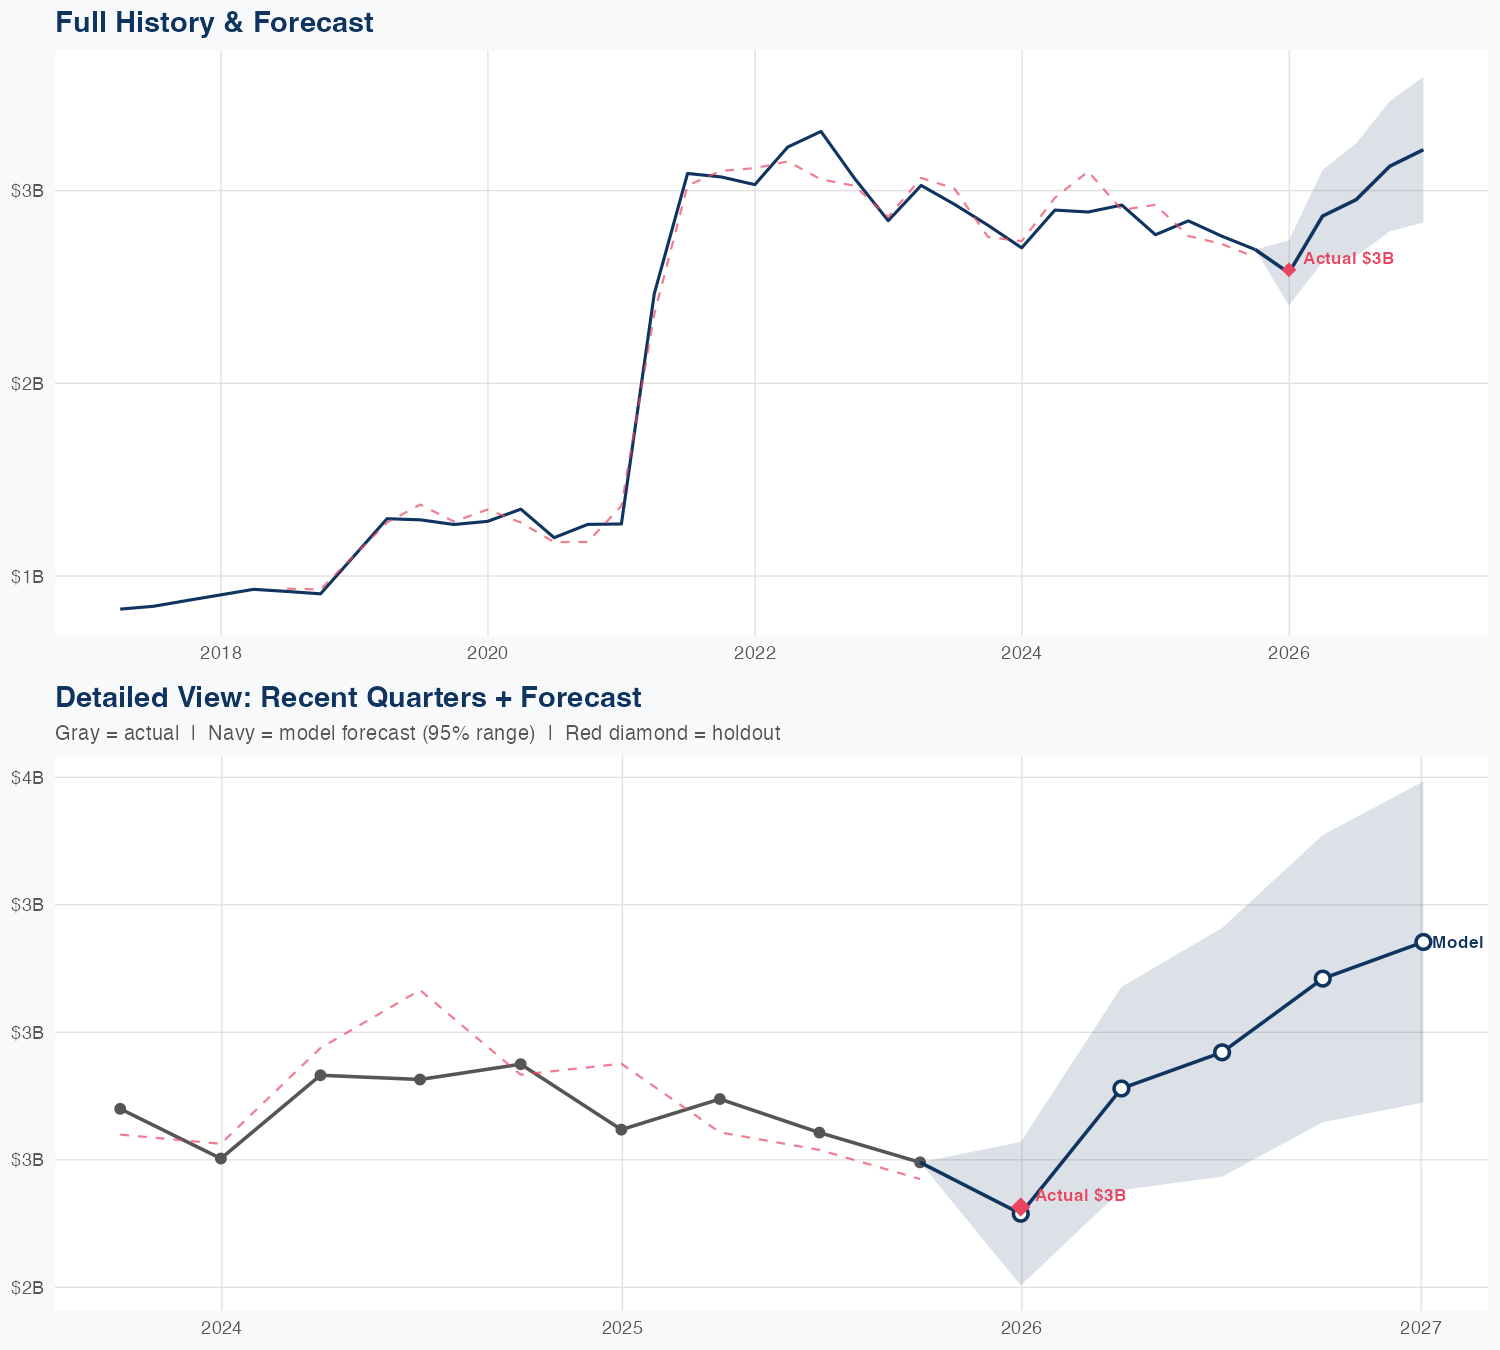
Quarterly Detail
| Quarter | Model Forecast | Actual | 95% Range | YoY Growth | Status |
|---|---|---|---|---|---|
| Q4 2025 | $2.6B | $2.6B | $2.4B – $2.7B | -7.1% | ✓ In range |
| Q2 2026 | $2.9B | $2.6B – $3.1B | +0.9% | ||
| Q3 2026 | $3.0B | $2.7B – $3.2B | +6.8% | ||
| Q4 2026 | $3.1B | $2.8B – $3.5B | +16.1% | ||
| Q1 2027 | $3.2B | $2.8B – $3.6B | +24.1% |
Seasonal Factors
| Fiscal Quarter | Seasonal Factor | vs Trend | Interpretation | Obs. |
|---|---|---|---|---|
| FQ1 (Sep–Nov) | 1.0126 | +1.3% | In line with trend | 8 |
| FQ2 (Dec–Feb) | 0.9726 | -2.7% | In line with trend | 7 |
| FQ3 (Mar–May) | 1.0236 | +2.4% | In line with trend | 7 |
| FQ4 (Jun–Aug) | 1.0149 | +1.5% | In line with trend | 8 |
How Spending Drives Revenue
Want this analysis for your portfolio?
I build custom revenue intelligence reports for investors and companies using SEC filing data, econometric modeling, and AI-powered insights.
Get in Touch