Intuitive Surgical, Inc. ISRG
Revenue Intelligence Report • 70 quarters of SEC filing data • Updated 2026-03-15
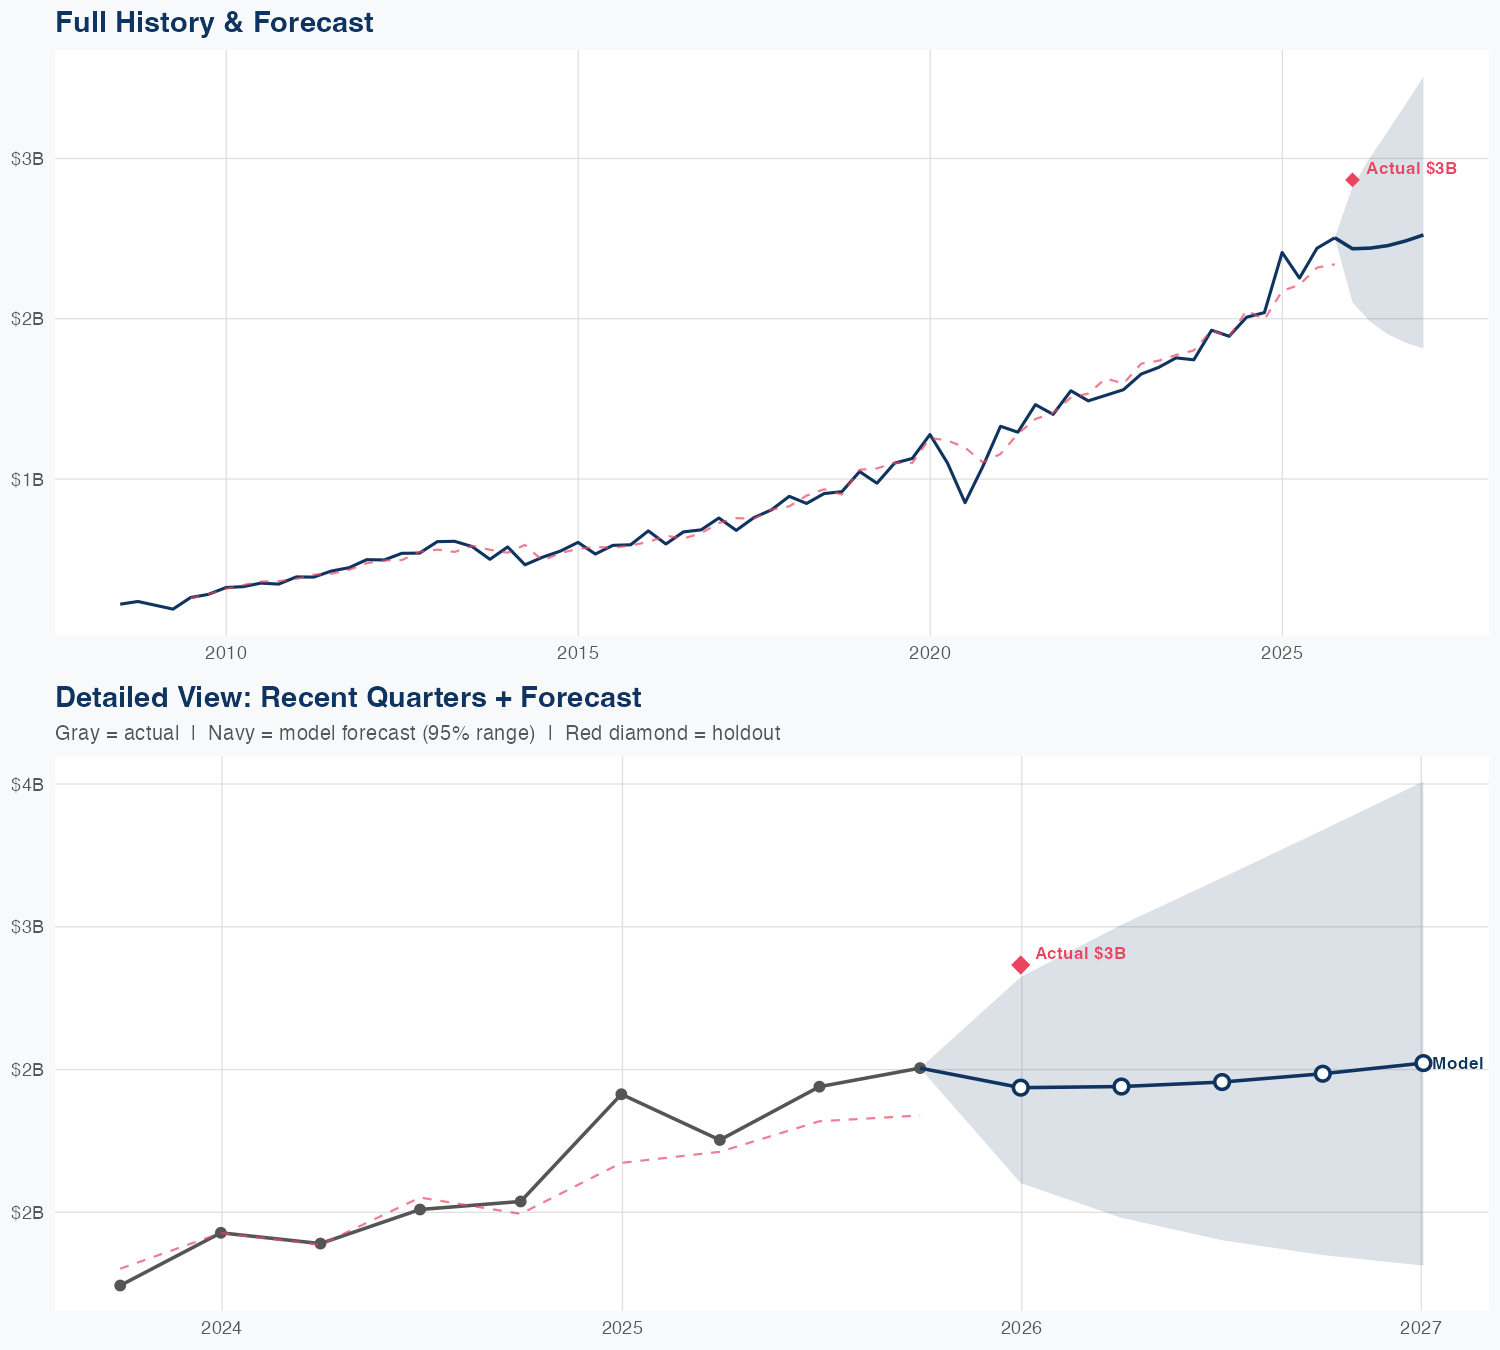
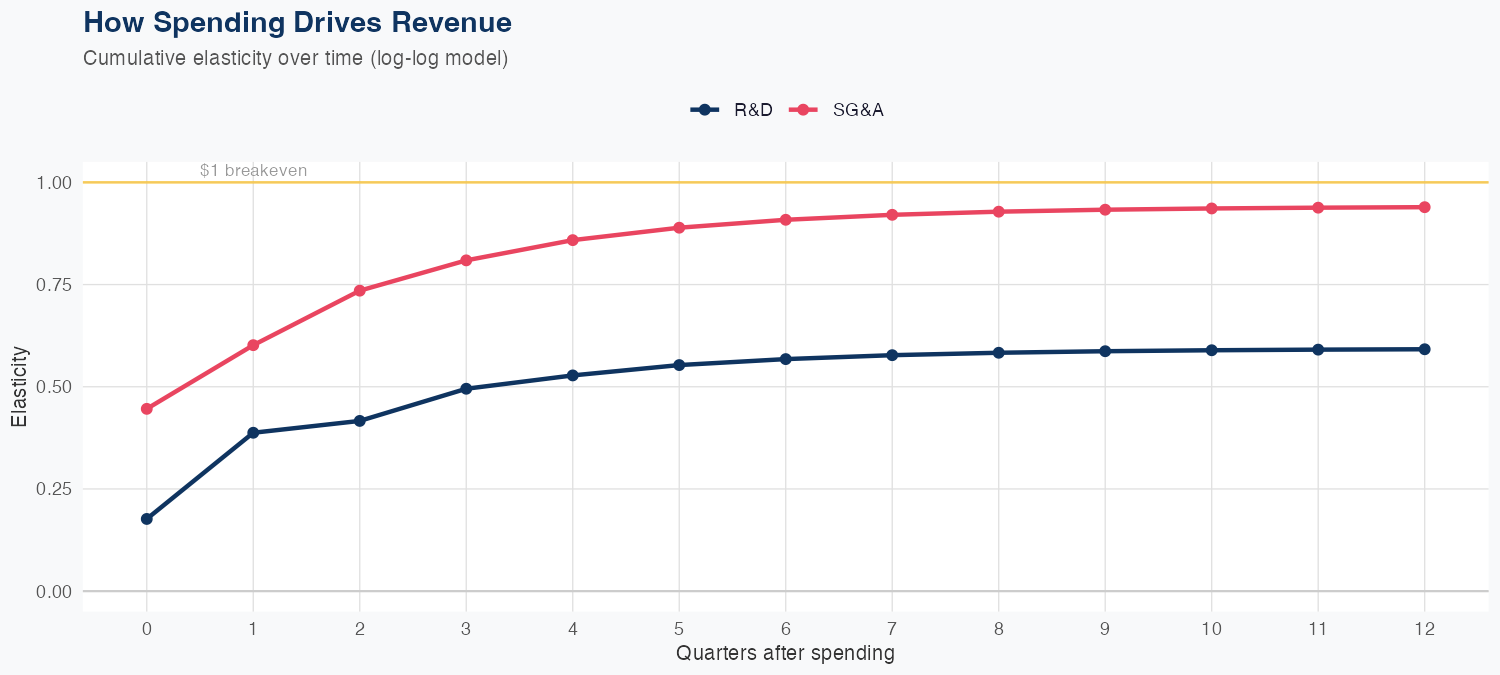
Quarterly revenue came in at $2.866 billion, with the model showing revenue is driven by SG&A and R&D spending; SG&A has the stronger elasticity at about 0.94 per 1% spend while R&D is about 0.59. In practical terms, each 1% increase in SG&A adds roughly 0.94% to revenue and each 1% increase in R&D adds roughly 0.59% to revenue, indicating revenue growth is sublinear to these cost investments. The model’s overall accuracy is 5.2% MAPE, and a holdout test predicted $2.4B versus actual $2.9B (about a 15% error), signaling some forecasting risk in edge periods. The full-year revenue forecast is $9.9B, down 1.6% year over year, suggesting near-term revenue softness even as SG&A and R&D investments are expected to persist.
Investment Thesis
The econometric model achieves strong accuracy (5.2% MAPE), suggesting Intuitive Surgical, Inc.'s revenue trajectory is well-characterized by its spending patterns. R&D investment shows a 0.59x multiplier — each 1% increase in R&D spend is associated with a 0.59% revenue increase, signaling strong innovation-to-revenue conversion. Sales & marketing spend shows a 0.94x elasticity, suggesting effective go-to-market execution.
Revenue Forecast
Quarterly Detail
| Quarter | Model Forecast | Actual | 95% Range | YoY Growth | Status |
|---|---|---|---|---|---|
| Q4 2025 | $2.4B | $2.9B | $2.1B – $2.8B | +1.0% | ✗ Outside range |
| Q2 2026 | $2.4B | $2.0B – $3.0B | +8.3% | ||
| Q3 2026 | $2.5B | $1.9B – $3.2B | +0.7% | ||
| Q4 2026 | $2.5B | $1.9B – $3.3B | -0.8% | ||
| Q1 2027 | $2.5B | $1.8B – $3.5B | -12.0% |
Seasonal Factors
| Fiscal Quarter | Seasonal Factor | vs Trend | Interpretation | Obs. |
|---|---|---|---|---|
| FQ1 (Sep–Nov) | 0.9988 | -0.1% | In line with trend | 17 |
| FQ2 (Dec–Feb) | 1.0463 | +4.6% | +4.6% above trend | 17 |
| FQ3 (Mar–May) | 0.9702 | -3.0% | In line with trend | 16 |
| FQ4 (Jun–Aug) | 1.0088 | +0.9% | In line with trend | 17 |
How Spending Drives Revenue
Want this analysis for your portfolio?
I build custom revenue intelligence reports for investors and companies using SEC filing data, econometric modeling, and AI-powered insights.
Get in Touch