Jacobs Solutions Inc. J
Revenue Intelligence Report • 51 quarters of SEC filing data • Updated 2026-03-15
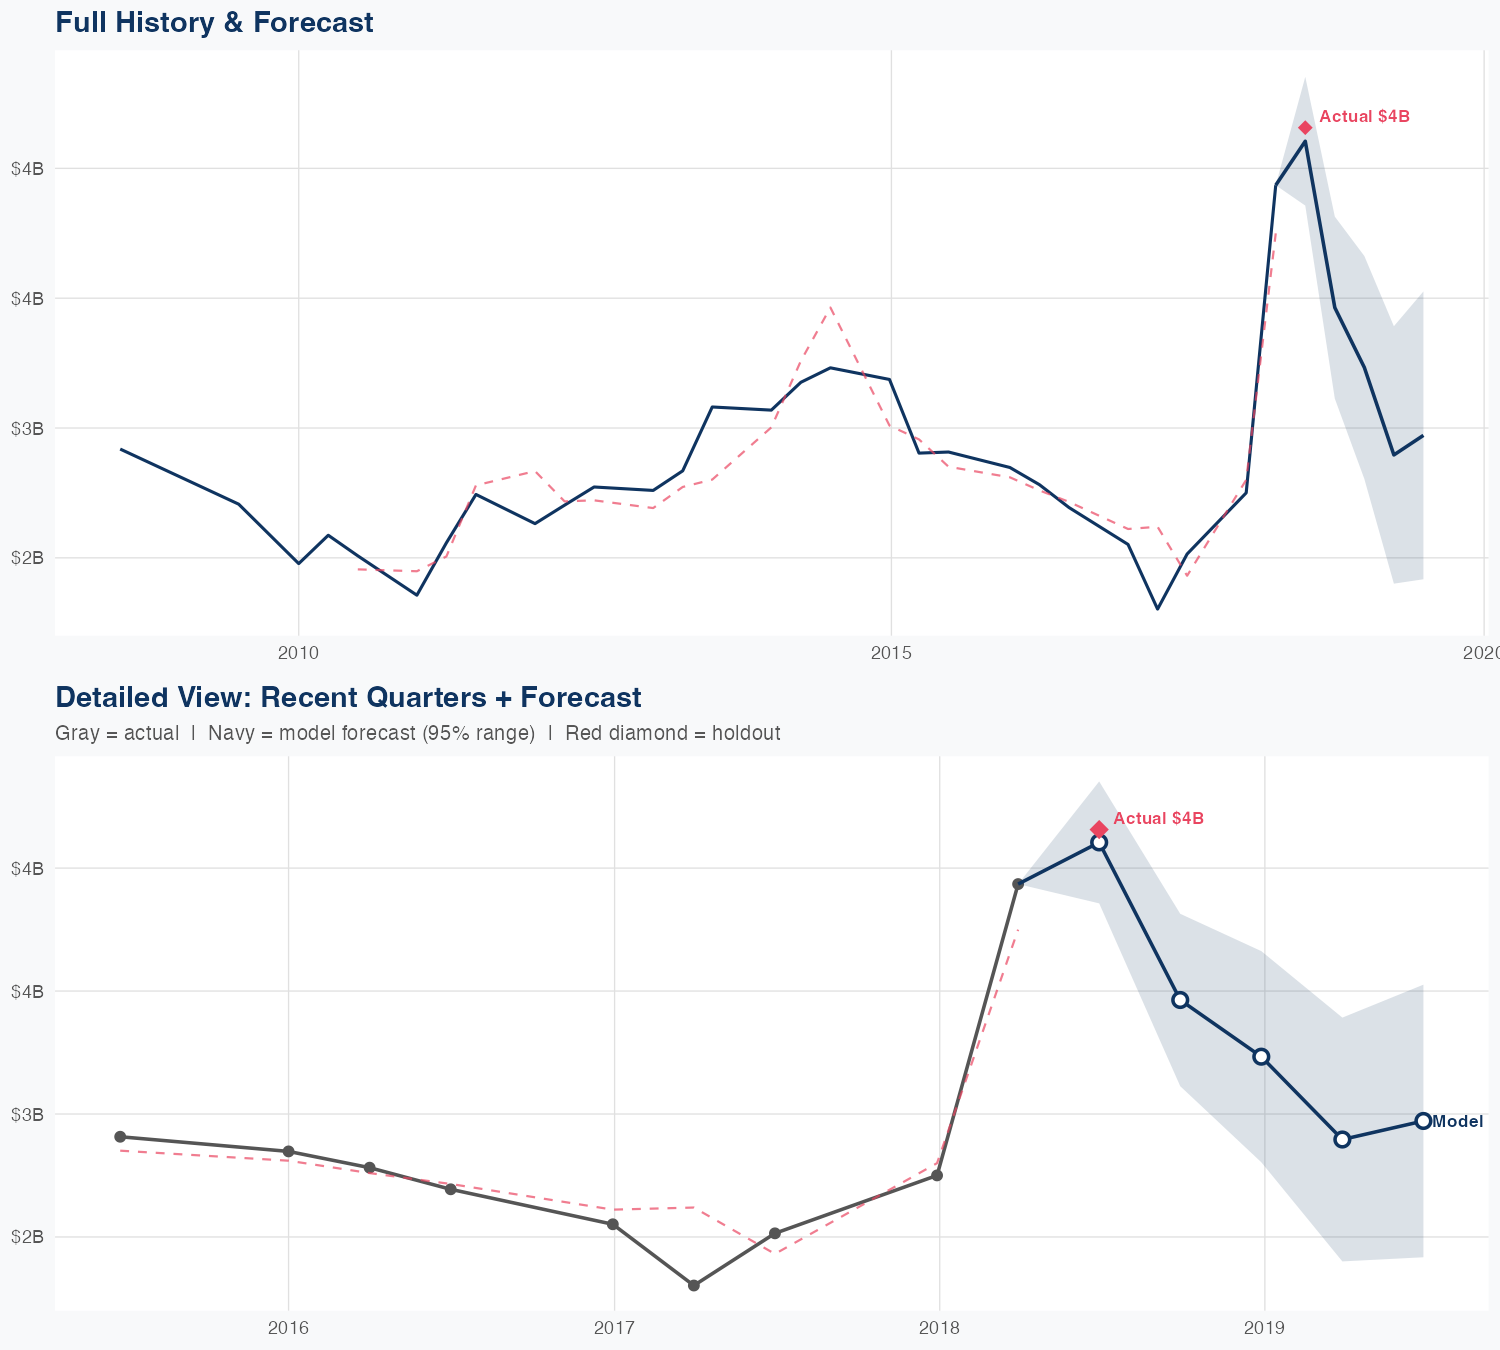
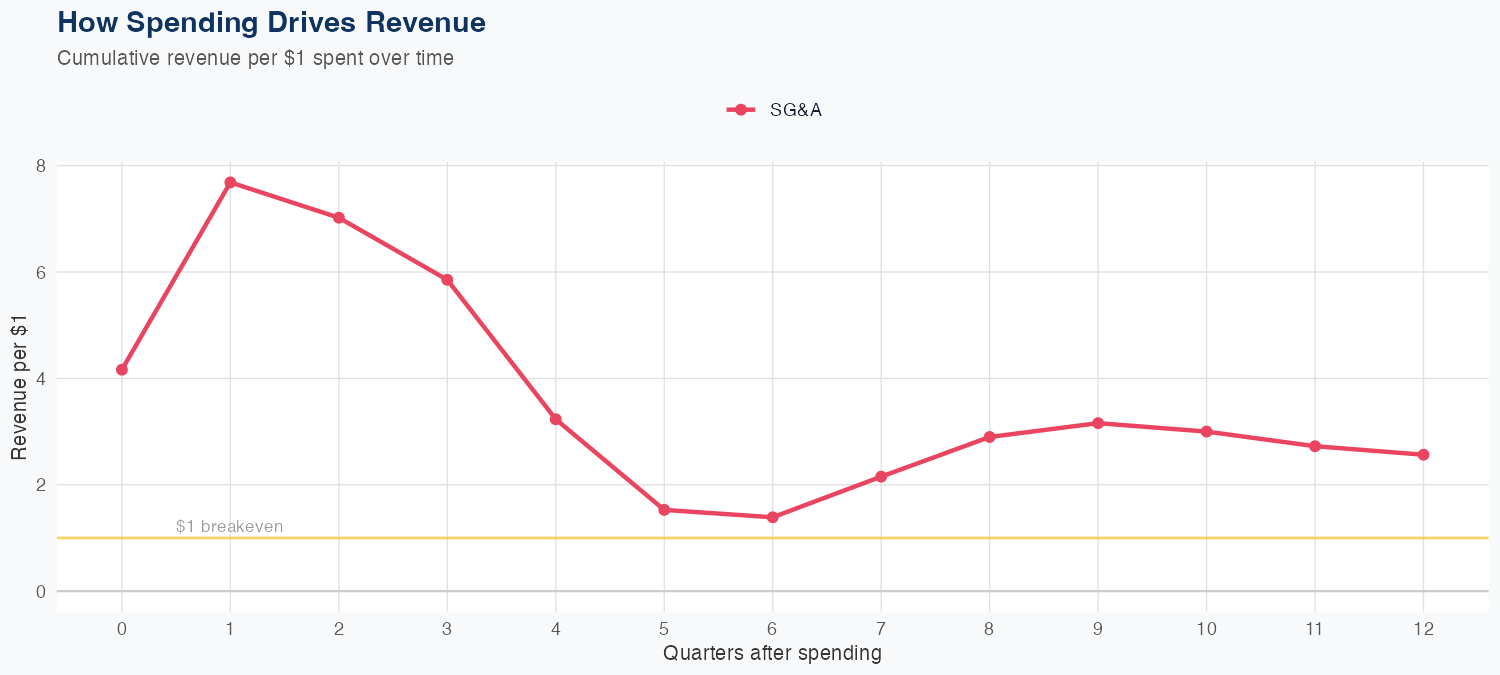
Revenue appears driven primarily by SG&A spending, with a 1% increase in SG&A associated with a 0.23% rise in revenue in this log-log model, a relationship supported by 51 quarters of data. The model shows 4.9% MAPE accuracy, with a holdout test predicting $3.0B versus $3.3B actual (7.5% error), indicating solid but not perfect short-term predictability. The FY forecast calls for about $12B in revenue, down 1.6% year over year, signaling a modest contraction despite SG&A-driven gains. The ROI on SG&A spend appears modest, suggesting incremental spend yields diminishing returns and highlighting the potential benefit of efficiency improvements or reallocation to higher-return initiatives.
Investment Thesis
The econometric model achieves strong accuracy (4.9% MAPE), suggesting Jacobs Solutions Inc.'s revenue trajectory is well-characterized by its spending patterns. Sales & marketing spend shows a 0.23x elasticity, suggesting effective go-to-market execution.
Revenue Forecast
Quarterly Detail
| Quarter | Model Forecast | Actual | 95% Range | YoY Growth | Status |
|---|---|---|---|---|---|
| Q3 2025 | $3.0B | $3.3B | $2.7B – $3.5B | +5.6% | ✓ In range |
| Q4 2025 | $3.0B | $2.5B – $3.6B | +2.6% | ||
| Q1 2026 | $3.0B | $2.4B – $3.8B | +2.9% | ||
| Q2 2026 | $3.0B | $2.3B – $3.9B | -1.5% | ||
| Q3 2026 | $3.0B | $2.2B – $4.0B | -9.5% |
Seasonal Factors
| Fiscal Quarter | Seasonal Factor | vs Trend | Interpretation | Obs. |
|---|---|---|---|---|
| FQ1 (Sep–Nov) | 1.0 | +0.0% | In line with trend | 0 |
| FQ2 (Dec–Feb) | 1.0119 | +1.2% | In line with trend | 17 |
| FQ3 (Mar–May) | 1.0086 | +0.9% | In line with trend | 16 |
| FQ4 (Jun–Aug) | 1.0019 | +0.2% | In line with trend | 16 |
How Spending Drives Revenue
Want this analysis for your portfolio?
I build custom revenue intelligence reports for investors and companies using SEC filing data, econometric modeling, and AI-powered insights.
Get in Touch