Eli Lilly and Company LLY
Revenue Intelligence Report • 60 quarters of SEC filing data • Updated 2026-03-15
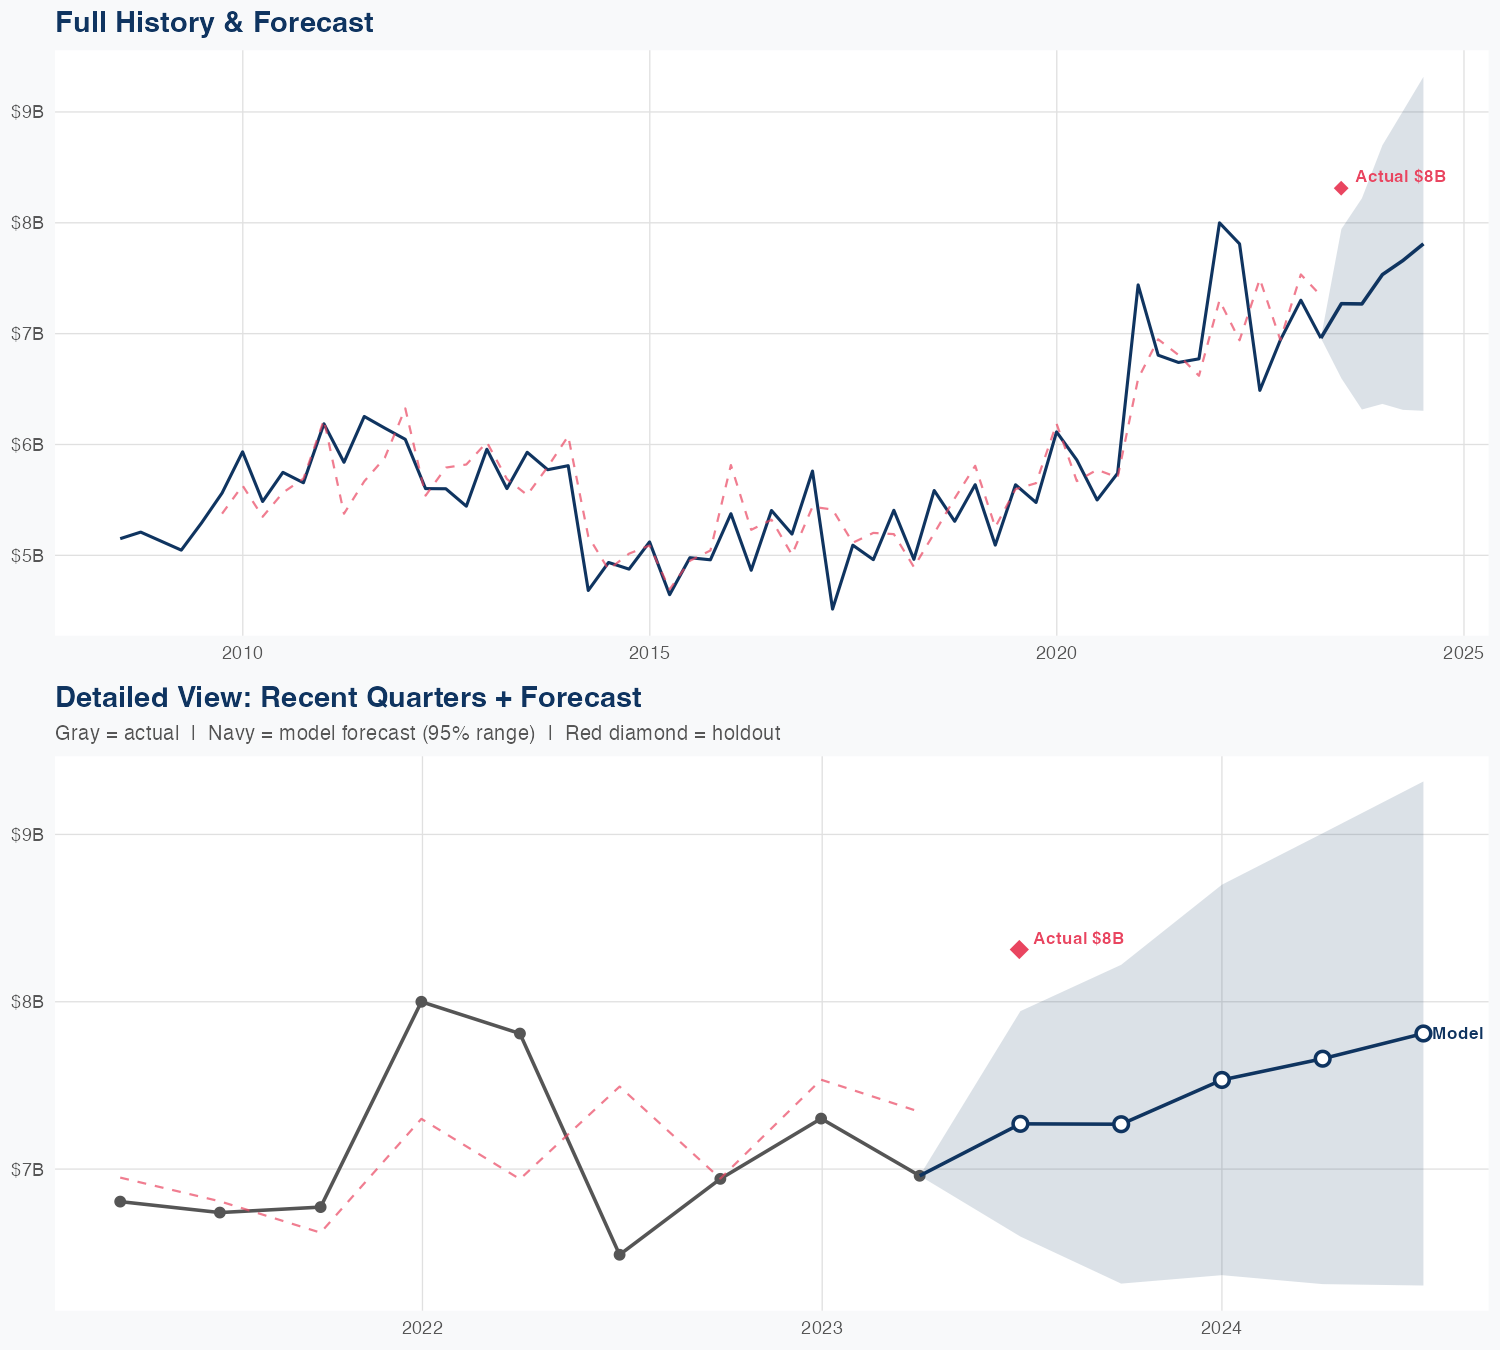
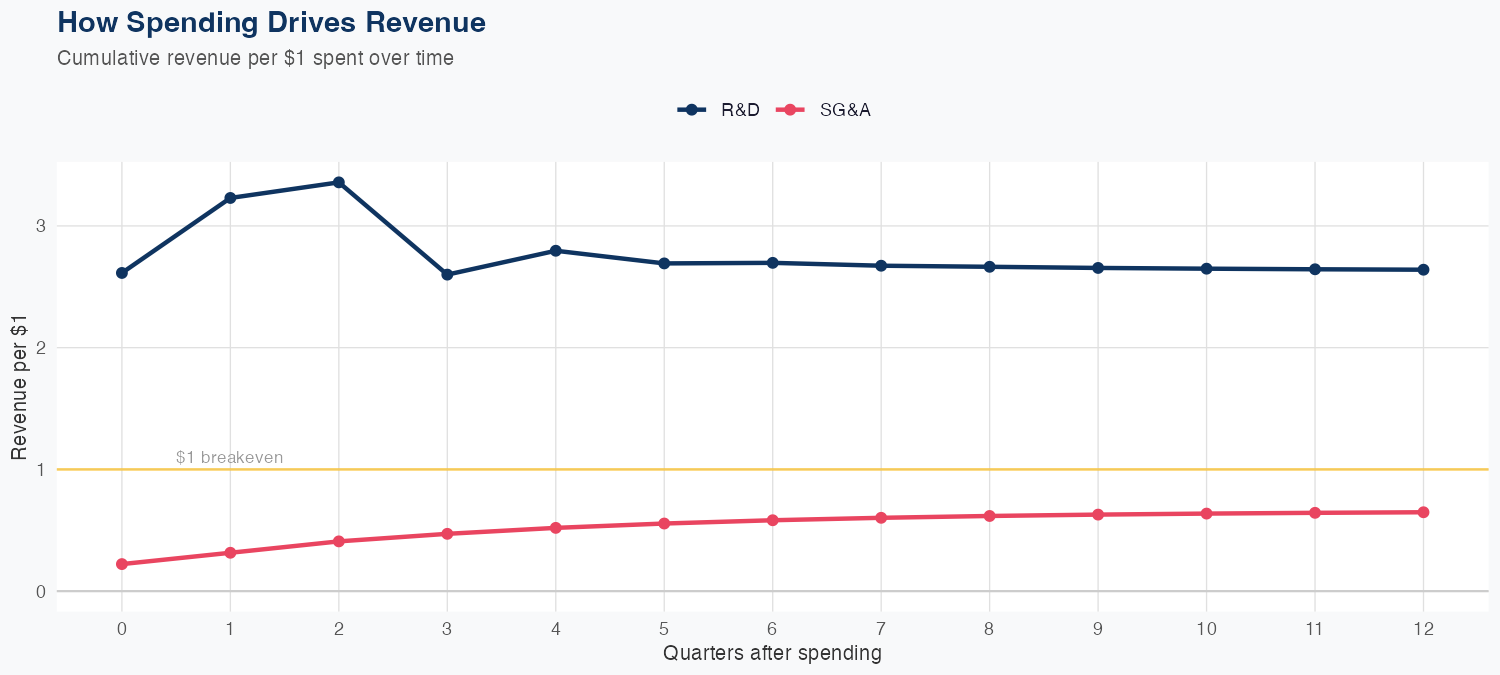
Revenue is predominantly driven by core product sales, with the latest quarterly revenue at about $8.31 billion and a 60-quarter data history underpinning the model. In this linear framework, every $1 of R&D spending translates to $2.64 of long-run revenue, while every $1 of SG&A yields $0.65, signaling R&D as the higher-ROI driver of growth. Model accuracy stands at 4.2% MAPE, but the holdout test produced a 12.5% error (predicted $7.3B vs actual $8.3B), flagging some forecasting risk. The FY revenue forecast is $30B, up 2.6% year over year, implying continued growth supported by R&D-driven upside despite the near-term miss.
Investment Thesis
The econometric model achieves strong accuracy (4.2% MAPE), suggesting Eli Lilly and Company's revenue trajectory is well-characterized by its spending patterns. Every $1 of R&D investment is associated with $2.64 of revenue, indicating efficient capital deployment in innovation. Each $1 of SG&A spending generates $0.65 in revenue, reflecting strong commercial efficiency.
Revenue Forecast
Quarterly Detail
| Quarter | Model Forecast | Actual | 95% Range | YoY Growth | Status |
|---|---|---|---|---|---|
| Q3 2023 | $7.3B | $8.3B | $6.6B – $7.9B | +12.1% | ✗ Outside range |
| Q4 2023 | $7.3B | $6.3B – $8.2B | +4.7% | ||
| Q1 2024 | $7.5B | $6.4B – $8.7B | +3.2% | ||
| Q2 2024 | $7.7B | $6.3B – $9.0B | +10.1% | ||
| Q3 2024 | $7.8B | $6.3B – $9.3B | -6.0% |
Seasonal Factors
| Fiscal Quarter | Seasonal Factor | vs Trend | Interpretation | Obs. |
|---|---|---|---|---|
| FQ1 (Sep–Nov) | 0.9956 | -0.4% | In line with trend | 14 |
| FQ2 (Dec–Feb) | 0.9944 | -0.6% | In line with trend | 14 |
| FQ3 (Mar–May) | 0.9898 | -1.0% | In line with trend | 14 |
| FQ4 (Jun–Aug) | 1.0132 | +1.3% | In line with trend | 14 |
How Spending Drives Revenue
Want this analysis for your portfolio?
I build custom revenue intelligence reports for investors and companies using SEC filing data, econometric modeling, and AI-powered insights.
Get in Touch