Live Nation Entertainment, Inc. LYV
Revenue Intelligence Report • 64 quarters of SEC filing data • Updated 2026-03-15
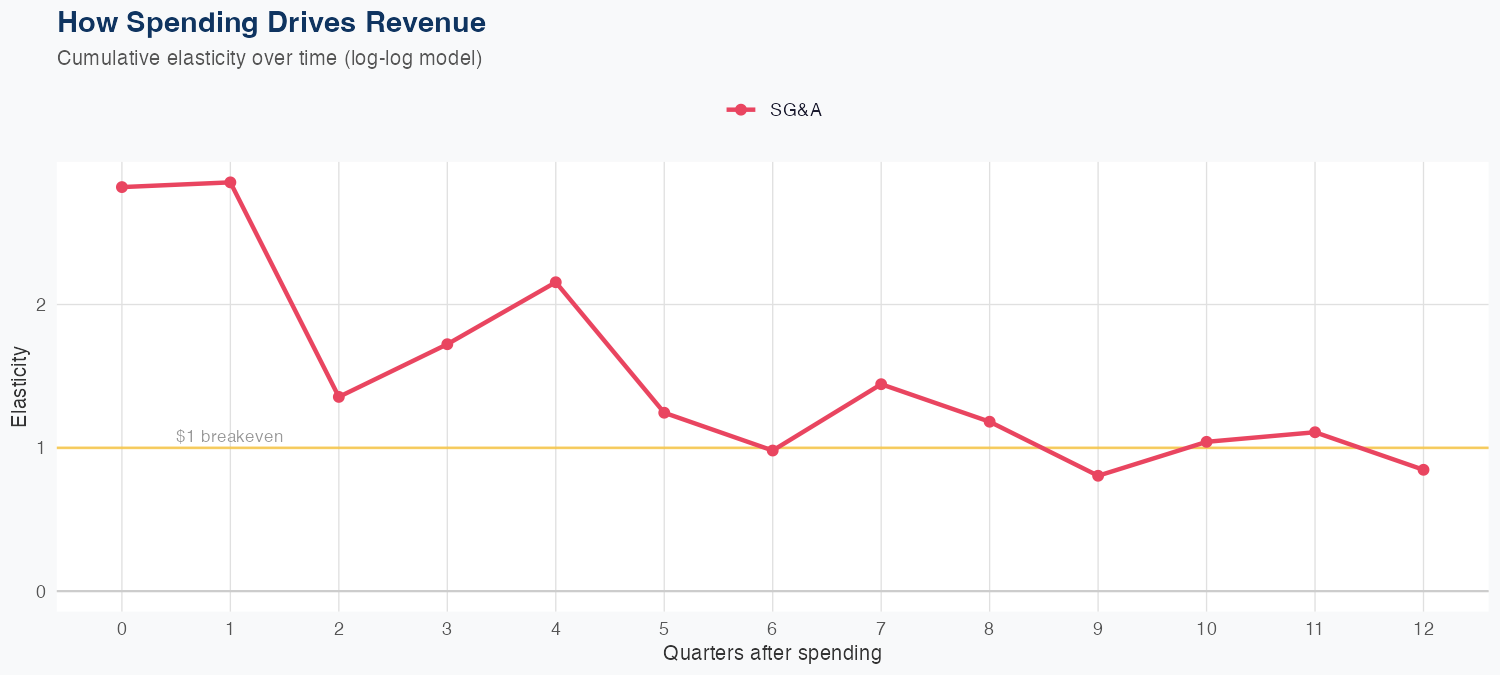
Latest quarterly revenue was $6.314B, and the model shows SG&A spending as a key revenue driver with an elasticity of 0.85% increase in revenue per 1% SG&A rise. However, predictive accuracy is limited, with a MAPE of 29.4% and a holdout miss of about 34% (predicted $4.2B vs actual $6.3B), indicating substantial uncertainty in relying on SG&A alone for forecasting. The FY revenue forecast is $16B, a 36.5% decline year over year, signaling a meaningful near-term slowdown. Investors should weigh the potential upside from SG&A-driven revenue growth against the model’s limited accuracy and the sizable expected YoY decline, highlighting a need for disciplined cost management and resilience to cyclical event-driven demand.
Investment Thesis
At 29.4% MAPE, the model captures Live Nation Entertainment, Inc.'s broad revenue trajectory, though quarterly variability suggests sensitivity to external factors. Sales & marketing spend shows a 0.85x elasticity, suggesting effective go-to-market execution.
Revenue Forecast
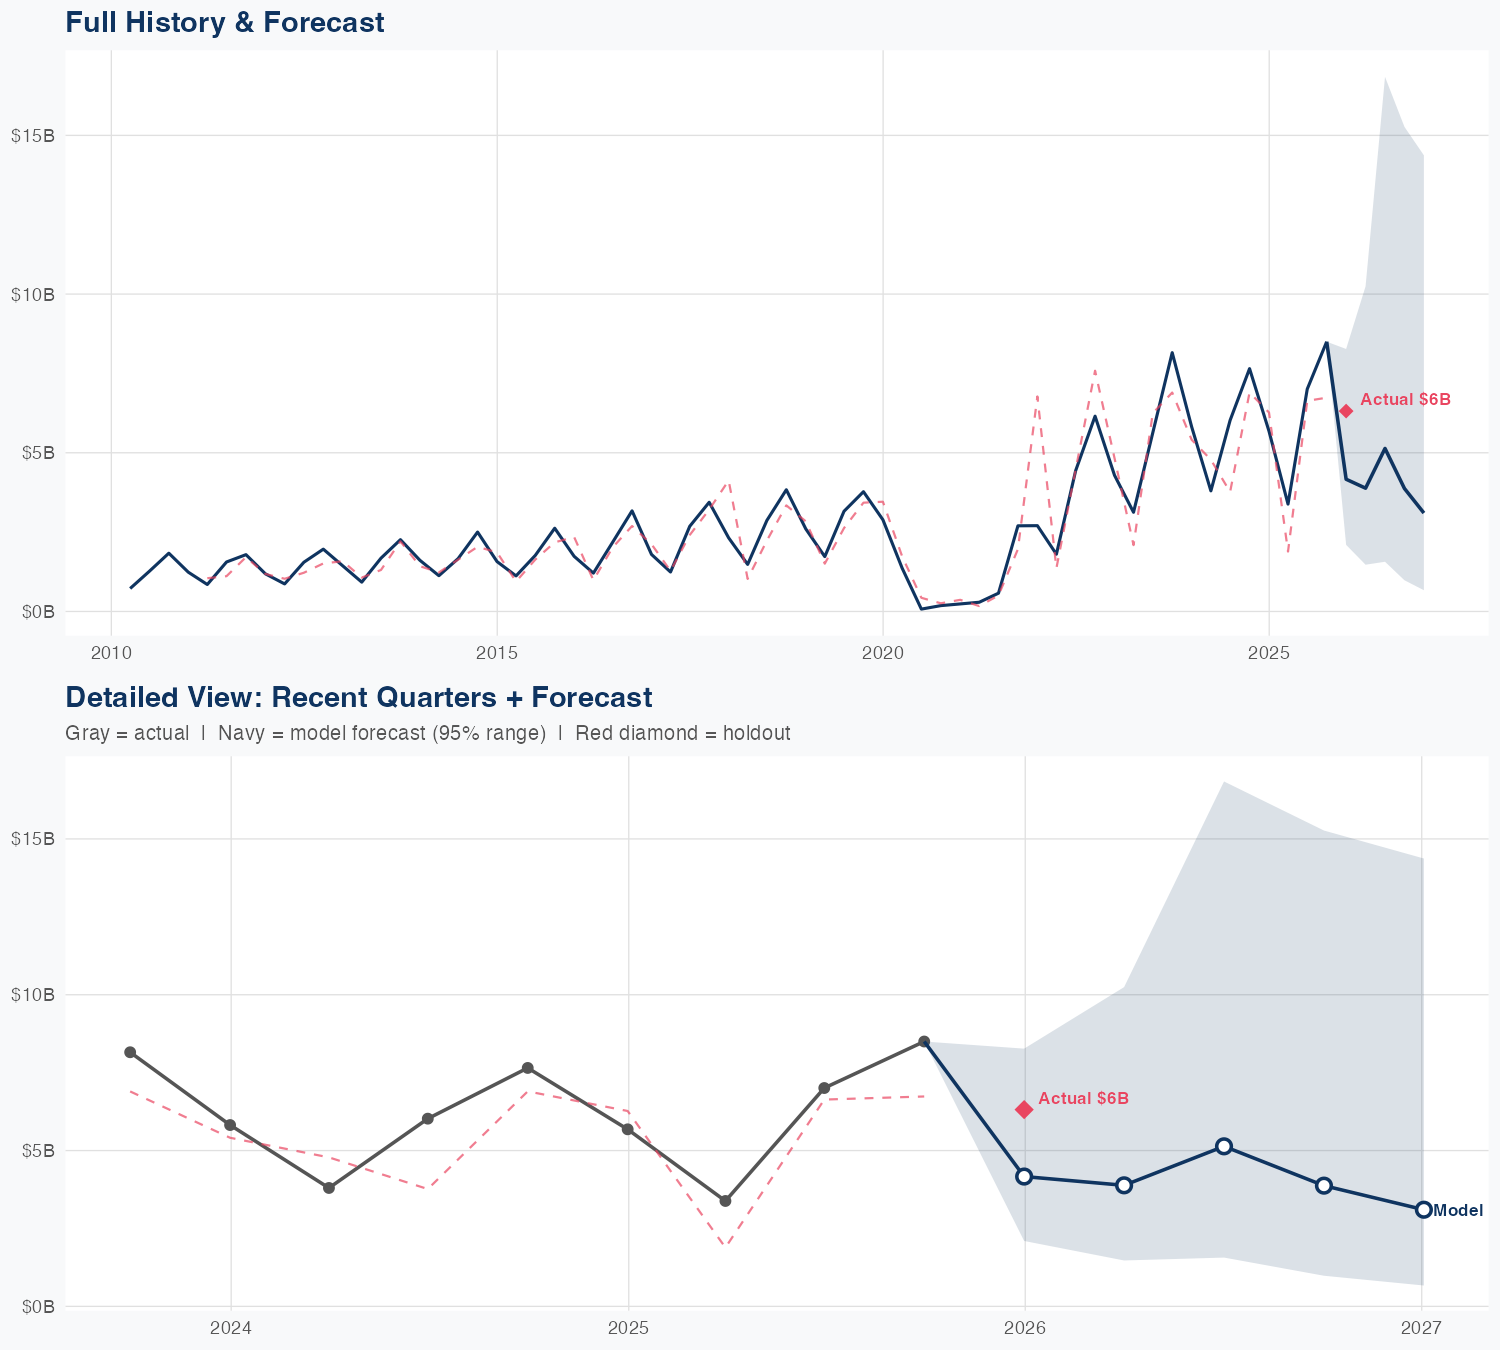
Quarterly Detail
| Quarter | Model Forecast | Actual | 95% Range | YoY Growth | Status |
|---|---|---|---|---|---|
| Q4 2025 | $4.2B | $6.3B | $2.1B – $8.3B | -26.7% | ✓ In range |
| Q2 2026 | $3.9B | $1.5B – $10B | +14.8% | ||
| Q3 2026 | $5.1B | $1.6B – $17B | -26.7% | ||
| Q4 2026 | $3.9B | $1.0B – $15B | -54.4% | ||
| Q1 2027 | $3.1B | $0.7B – $14B | -50.9% |
Seasonal Factors
| Fiscal Quarter | Seasonal Factor | vs Trend | Interpretation | Obs. |
|---|---|---|---|---|
| FQ1 (Sep–Nov) | 1.1475 | +14.8% | +14.8% above trend | 15 |
| FQ2 (Dec–Feb) | 0.8478 | -15.2% | -15.2% below trend | 15 |
| FQ3 (Mar–May) | 1.1471 | +14.7% | +14.7% above trend | 15 |
| FQ4 (Jun–Aug) | 1.114 | +11.4% | +11.4% above trend | 15 |
How Spending Drives Revenue
Want this analysis for your portfolio?
I build custom revenue intelligence reports for investors and companies using SEC filing data, econometric modeling, and AI-powered insights.
Get in Touch