Meta Platforms, Inc. META
Revenue Intelligence Report • 58 quarters of SEC filing data • Updated 2026-03-15
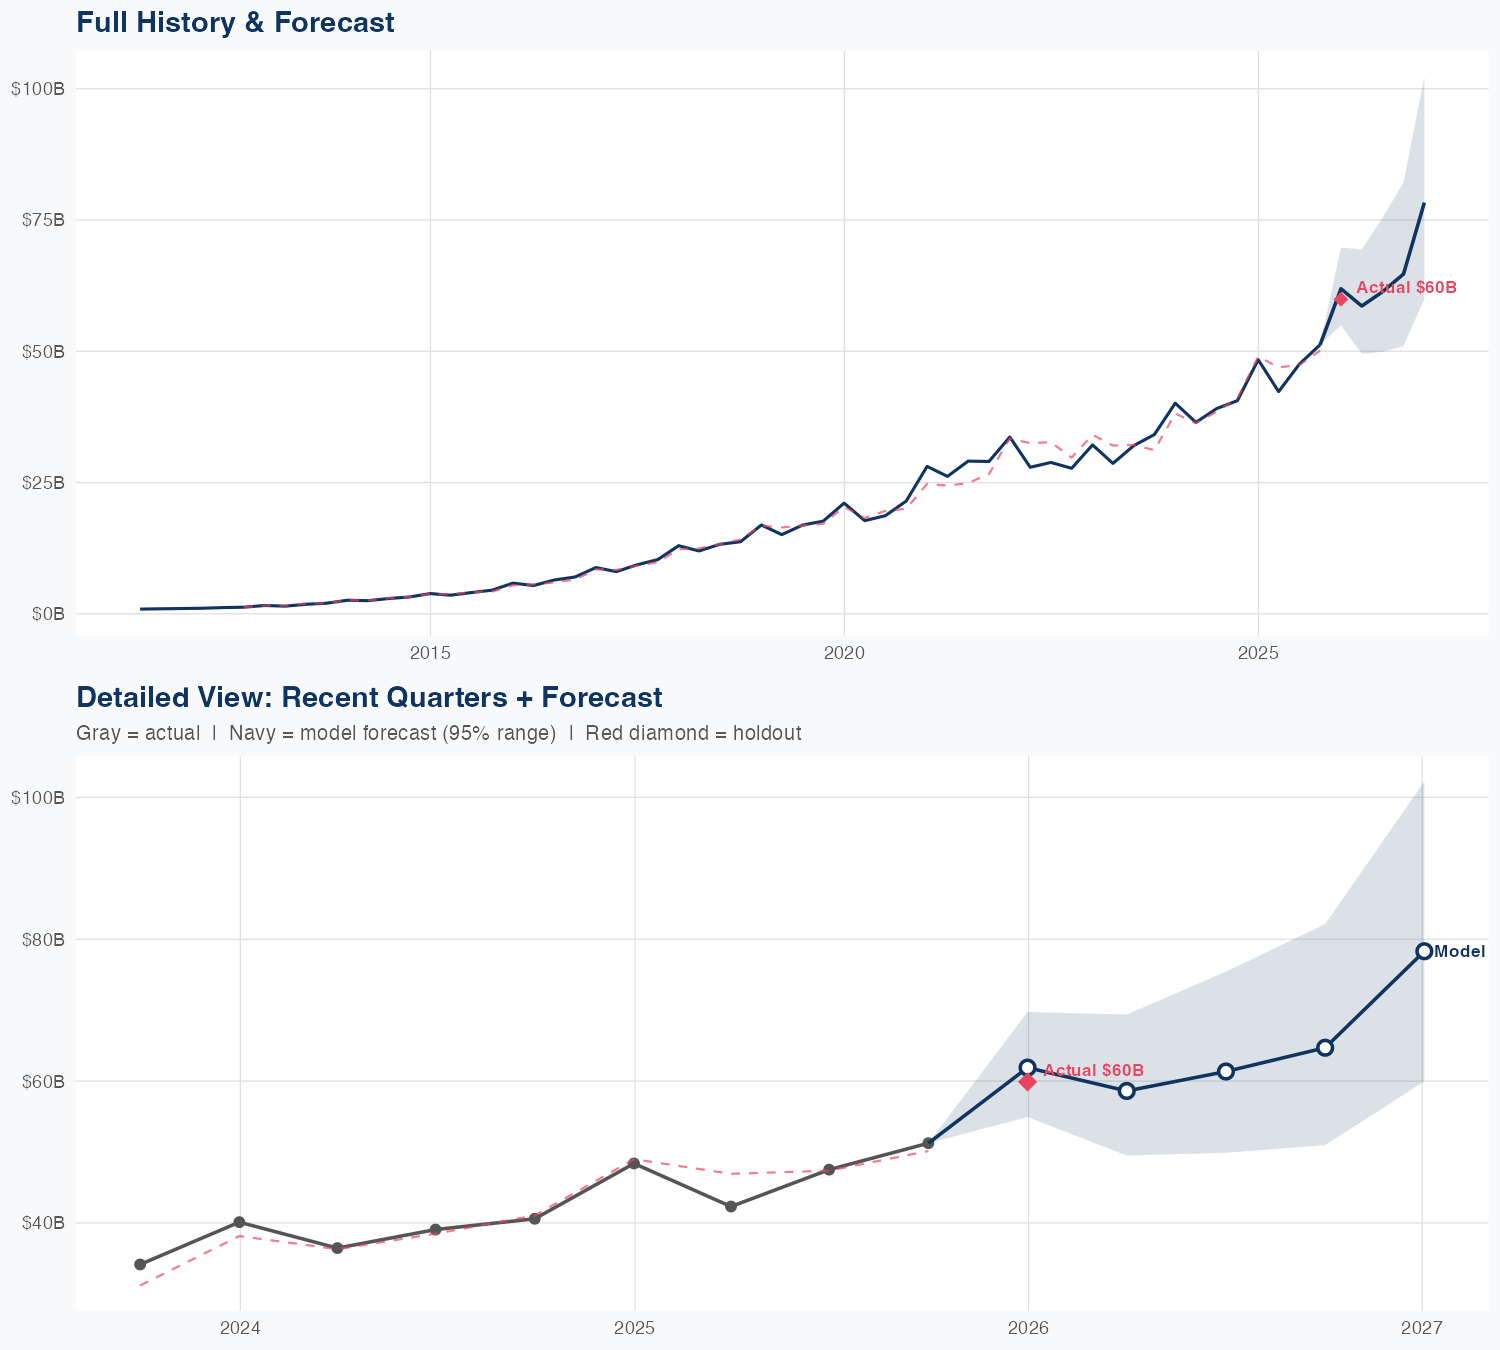
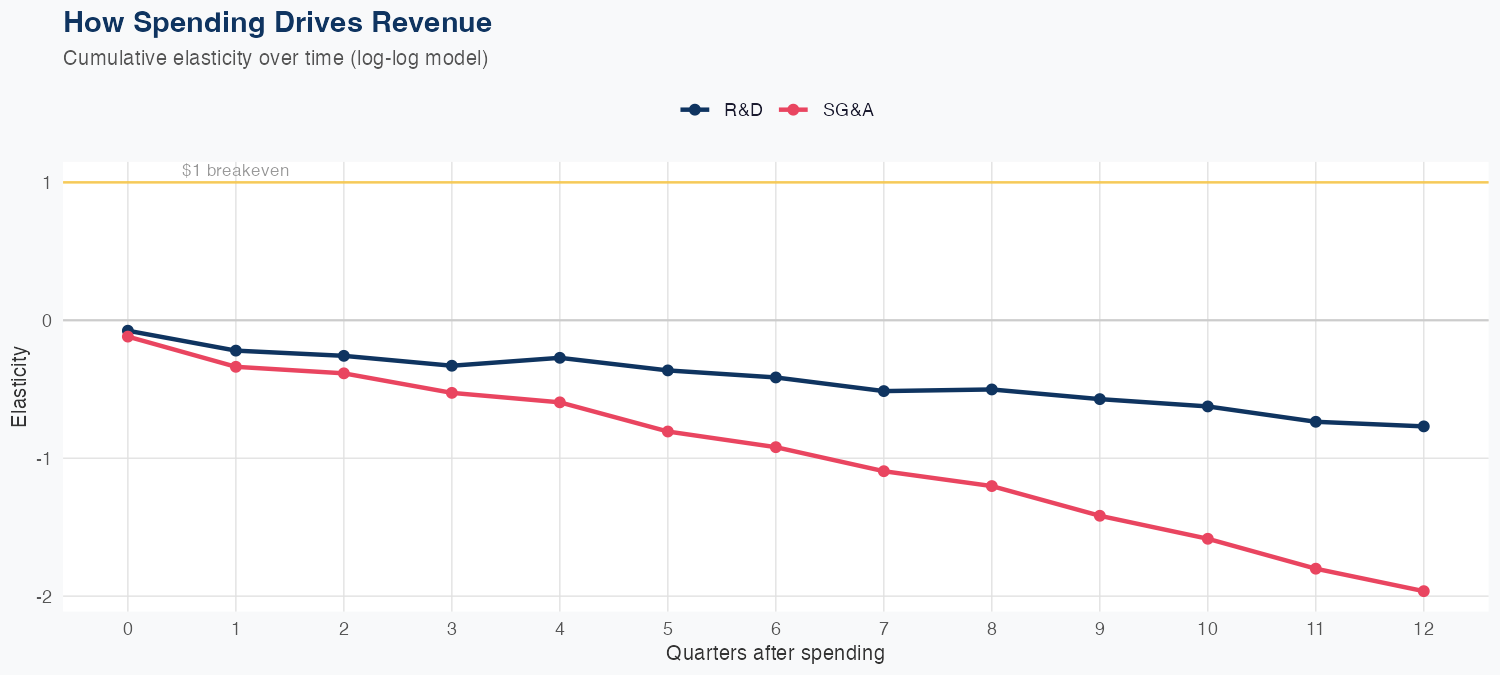
META posted FY revenue of $263B, up 30.9% YoY, but our econometric model shows the step-up isn’t driven by higher R&D or SG&A spending; R&D elasticity -0.77x and SG&A elasticity -1.96x imply incremental investments in these lines are not the near-term growth engine and may even dampen revenue. Growth instead comes from core monetization levers—user engagement, ad pricing, and platform mix. The holdout predicted $61.9B vs actual $59.9B, a 3.4% miss, with 4.7% MAPE indicating reasonable out-of-sample reliability but exposure to regime shifts in ad demand or regulation. Risks include ad-market cycles, data/privacy regulation, competition from TikTok, and the uncertain ROI of AI-driven monetization.
Investment Thesis
The econometric model achieves strong accuracy (4.7% MAPE), suggesting Meta Platforms, Inc.'s revenue trajectory is well-characterized by its spending patterns. R&D spending currently shows a negative elasticity (-0.77x), which can indicate heavy investment in long-cycle initiatives not yet reflected in revenue.
Revenue Forecast
Quarterly Detail
| Quarter | Model Forecast | Actual | 95% Range | YoY Growth | Status |
|---|---|---|---|---|---|
| Q4 2025 | $62B | $60B | $55B – $70B | +27.9% | ✓ In range |
| Q2 2026 | $59B | $50B – $69B | +38.5% | ||
| Q3 2026 | $61B | $50B – $75B | +29.1% | ||
| Q4 2026 | $65B | $51B – $82B | +26.3% | ||
| Q1 2027 | $78B | $60B – $102B | +30.7% |
Latest Earnings Call
Q4 2025Seasonal Factors
| Fiscal Quarter | Seasonal Factor | vs Trend | Interpretation | Obs. |
|---|---|---|---|---|
| FQ1 (Sep–Nov) | 1.0295 | +3.0% | In line with trend | 14 |
| FQ2 (Dec–Feb) | 1.0208 | +2.1% | In line with trend | 14 |
| FQ3 (Mar–May) | 0.9605 | -3.9% | -3.9% below trend | 13 |
| FQ4 (Jun–Aug) | 0.997 | -0.3% | In line with trend | 13 |
How Spending Drives Revenue
Want this analysis for your portfolio?
I build custom revenue intelligence reports for investors and companies using SEC filing data, econometric modeling, and AI-powered insights.
Get in Touch