Servicenow, Inc. NOW
Revenue Intelligence Report • 58 quarters of SEC filing data • Updated 2026-03-15
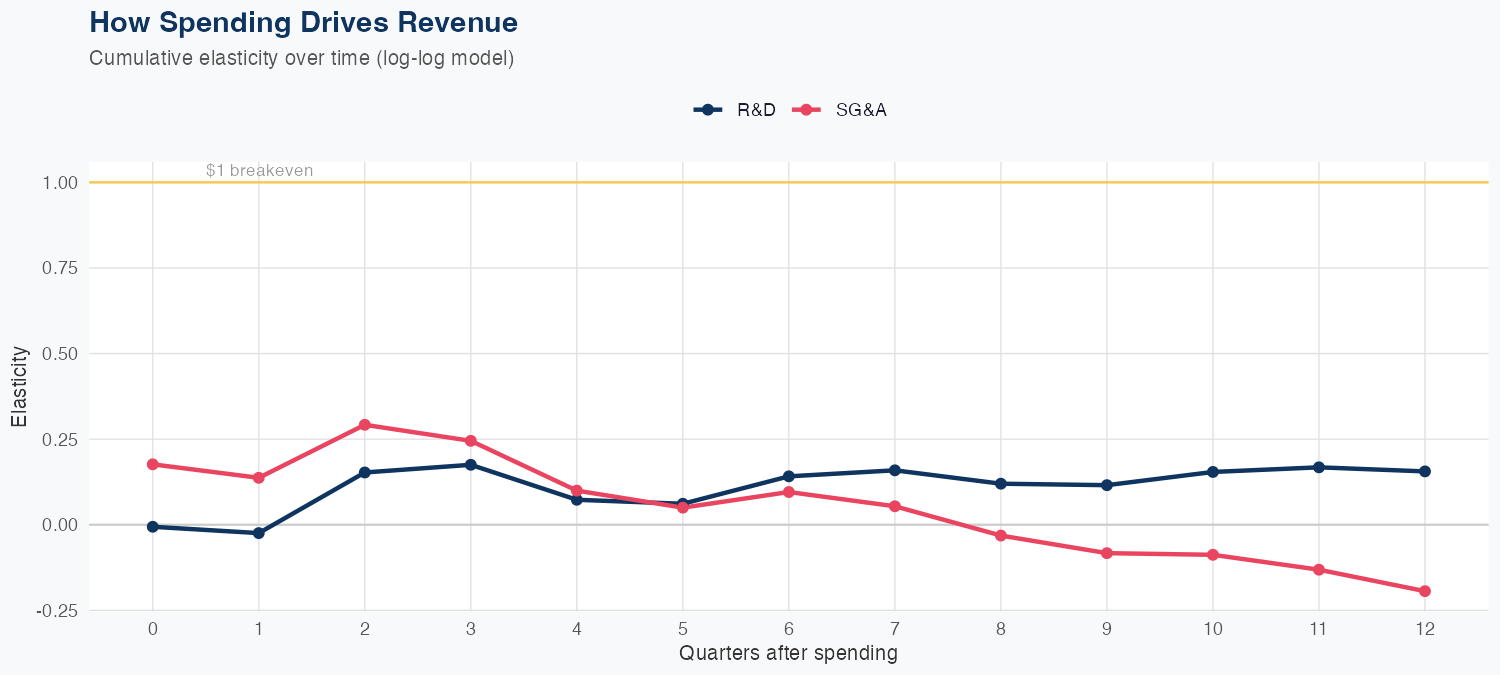
Revenue growth is driven by targeted R&D investment, which yields about a 0.18% revenue lift for every 1% increase in R&D spend, while SG&A expansion reduces revenue by about 0.23% per 1% rise, in a log-log framework. The model shows strong accuracy with a 1.0% MAPE and a holdout test where the forecast of roughly $3.6B closely matched the actual $3.568B within 0.4%. The FY revenue forecast stands at $16B, up 20.3% year over year, indicating solid top-line momentum. Going forward, prioritize R&D to sustain growth while pursuing SG&A efficiency to protect margins, given the negative revenue elasticity of SG&A spending.
Investment Thesis
Our ARDL model tracks Servicenow, Inc.'s revenue with exceptional precision (1.0% MAPE), indicating highly predictable cash flows. R&D investment shows a 0.18x multiplier — each 1% increase in R&D spend is associated with a 0.18% revenue increase, signaling strong innovation-to-revenue conversion.
Revenue Forecast
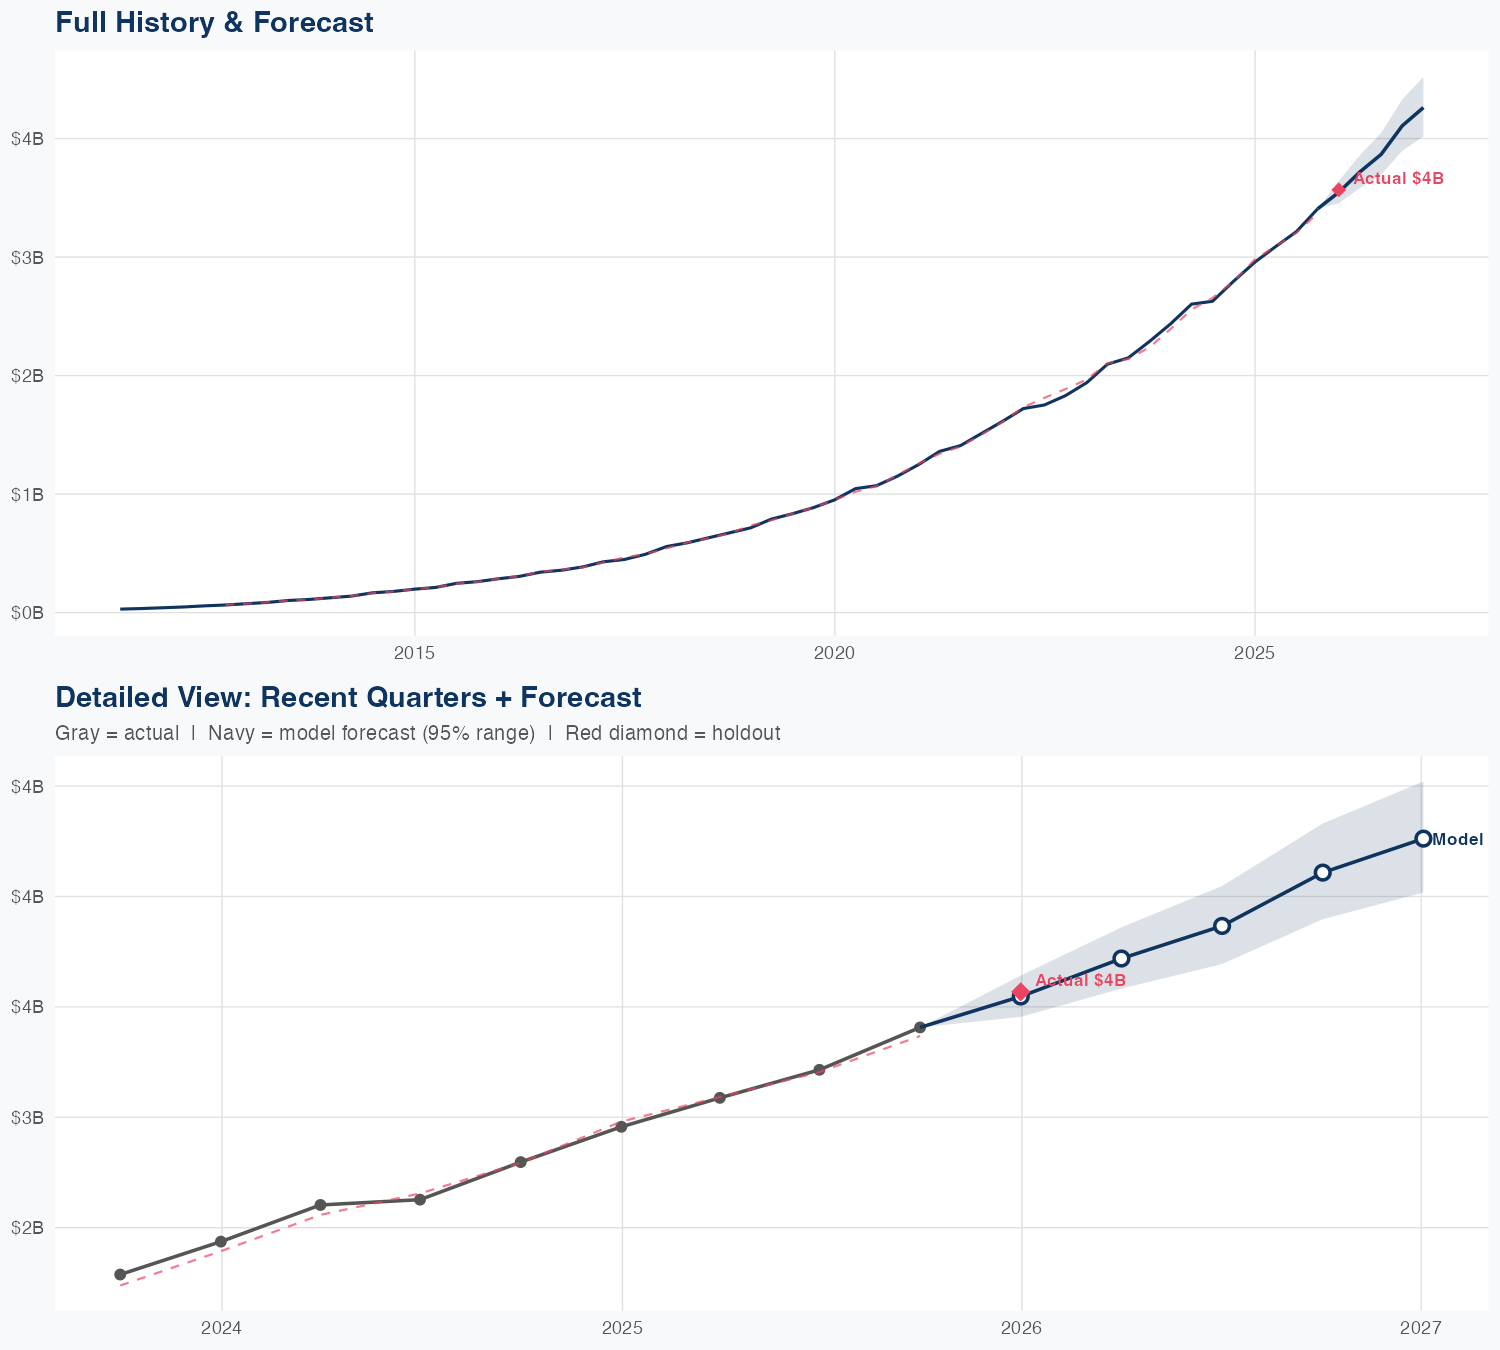
Quarterly Detail
| Quarter | Model Forecast | Actual | 95% Range | YoY Growth | Status |
|---|---|---|---|---|---|
| Q4 2025 | $3.6B | $3.6B | $3.5B – $3.6B | +20.1% | ✓ In range |
| Q2 2026 | $3.7B | $3.6B – $3.9B | +20.4% | ||
| Q3 2026 | $3.9B | $3.7B – $4.1B | +20.5% | ||
| Q4 2026 | $4.1B | $3.9B – $4.3B | +20.7% | ||
| Q1 2027 | $4.3B | $4.0B – $4.5B | +19.7% |
Seasonal Factors
| Fiscal Quarter | Seasonal Factor | vs Trend | Interpretation | Obs. |
|---|---|---|---|---|
| FQ1 (Sep–Nov) | 1.0023 | +0.2% | In line with trend | 14 |
| FQ2 (Dec–Feb) | 0.9999 | -0.0% | In line with trend | 14 |
| FQ3 (Mar–May) | 0.9962 | -0.4% | In line with trend | 13 |
| FQ4 (Jun–Aug) | 1.0027 | +0.3% | In line with trend | 13 |
How Spending Drives Revenue
Want this analysis for your portfolio?
I build custom revenue intelligence reports for investors and companies using SEC filing data, econometric modeling, and AI-powered insights.
Get in Touch