Ptc Inc. PTC
Revenue Intelligence Report • 50 quarters of SEC filing data • Updated 2026-03-15
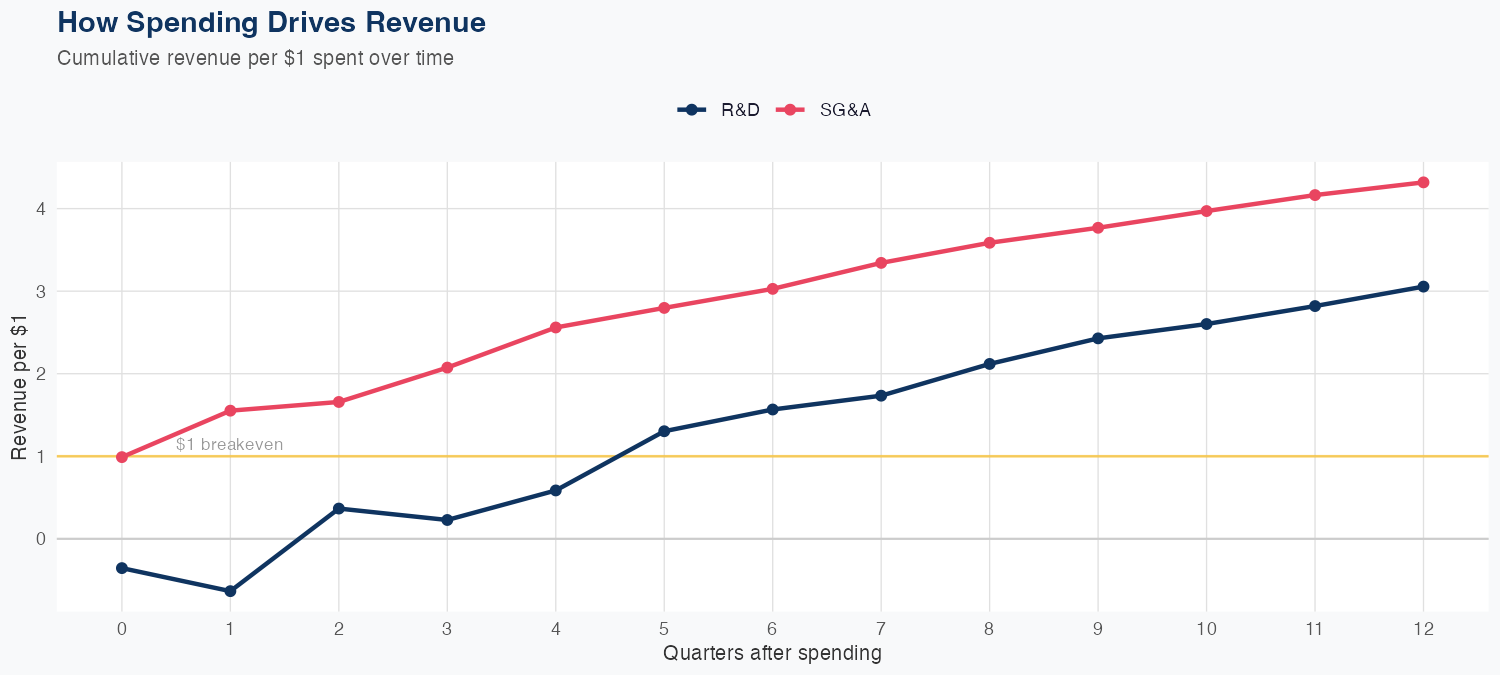
Revenue is driven by a linear spend-to-revenue relationship where each dollar of R&D adds 3.06 dollars of long-run revenue and each dollar of SG&A adds 4.32 dollars, making SG&A the higher-ROI driver in the model. The model is trained on 50 quarters with a 4.1% MAPE and a holdout miss of 6.2% (predicted 643M vs actual 686M), indicating reasonable predictive accuracy and some out-of-sample bias. Implied returns per dollar spent are roughly 206% for R&D and 332% for SG&A, highlighting strong leverage in both categories, especially SG&A. The FY forecast of 2.72B in revenue, up 7.4% year over year, points to a solid growth trajectory that should support continued revenue generation from these expense-driven dynamics, assuming the relationships hold.
Investment Thesis
The econometric model achieves strong accuracy (4.1% MAPE), suggesting Ptc Inc.'s revenue trajectory is well-characterized by its spending patterns. Every $1 of R&D investment is associated with $3.06 of revenue, indicating efficient capital deployment in innovation. Each $1 of SG&A spending generates $4.32 in revenue, reflecting strong commercial efficiency.
Revenue Forecast
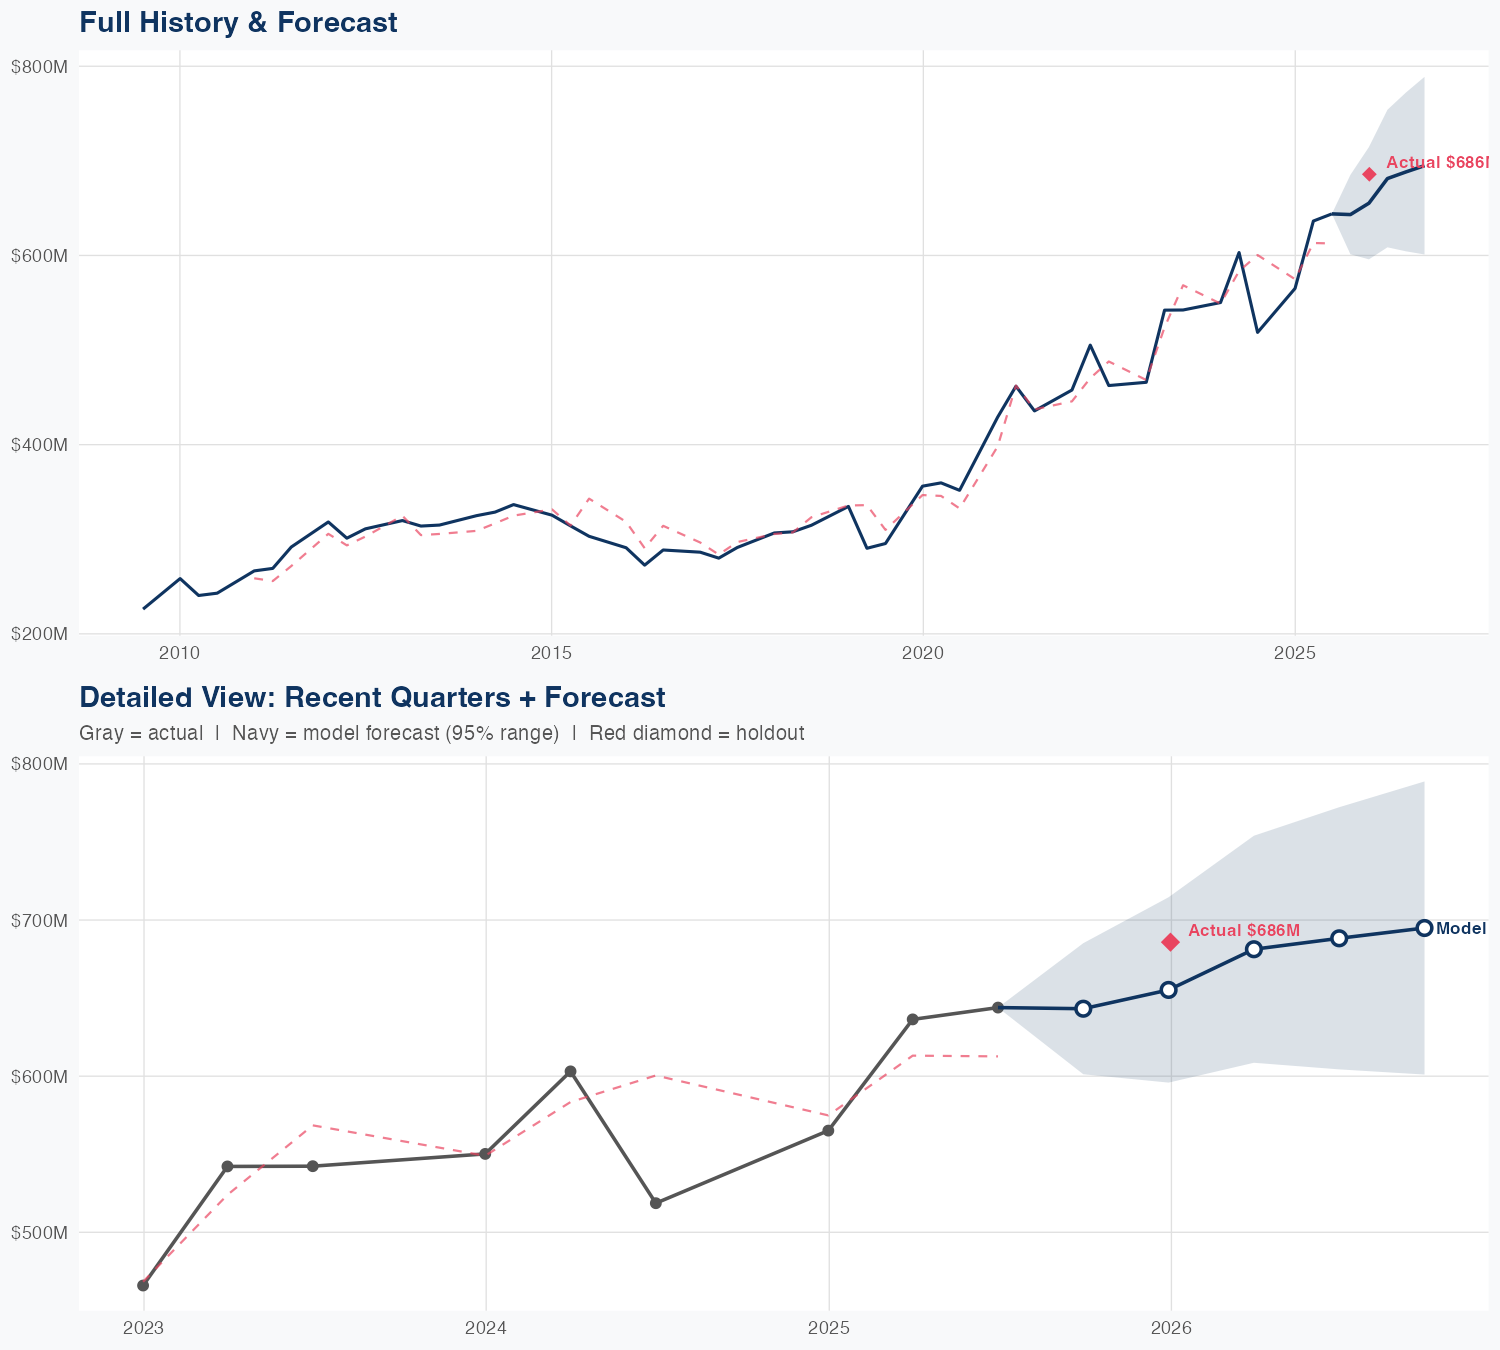
Quarterly Detail
| Quarter | Model Forecast | Actual | 95% Range | YoY Growth | Status |
|---|---|---|---|---|---|
| Q3 2025 | $643B | $686B | $601B – $685B | +24.0% | ✗ Outside range |
| Q4 2025 | $655B | $596B – $715B | +15.9% | ||
| Q1 2026 | $681B | $609B – $754B | +7.1% | ||
| Q2 2026 | $688B | $604B – $772B | +6.9% | ||
| Q3 2026 | $695B | $601B – $789B | +1.3% |
Seasonal Factors
| Fiscal Quarter | Seasonal Factor | vs Trend | Interpretation | Obs. |
|---|---|---|---|---|
| FQ1 (Sep–Nov) | 1.0 | +0.0% | In line with trend | 0 |
| FQ2 (Dec–Feb) | 1.0036 | +0.4% | In line with trend | 16 |
| FQ3 (Mar–May) | 1.0315 | +3.1% | +3.1% above trend | 15 |
| FQ4 (Jun–Aug) | 0.9807 | -1.9% | In line with trend | 15 |
How Spending Drives Revenue
Want this analysis for your portfolio?
I build custom revenue intelligence reports for investors and companies using SEC filing data, econometric modeling, and AI-powered insights.
Get in Touch