Verizon Communications Inc. VZ
Revenue Intelligence Report • 70 quarters of SEC filing data • Updated 2026-03-15
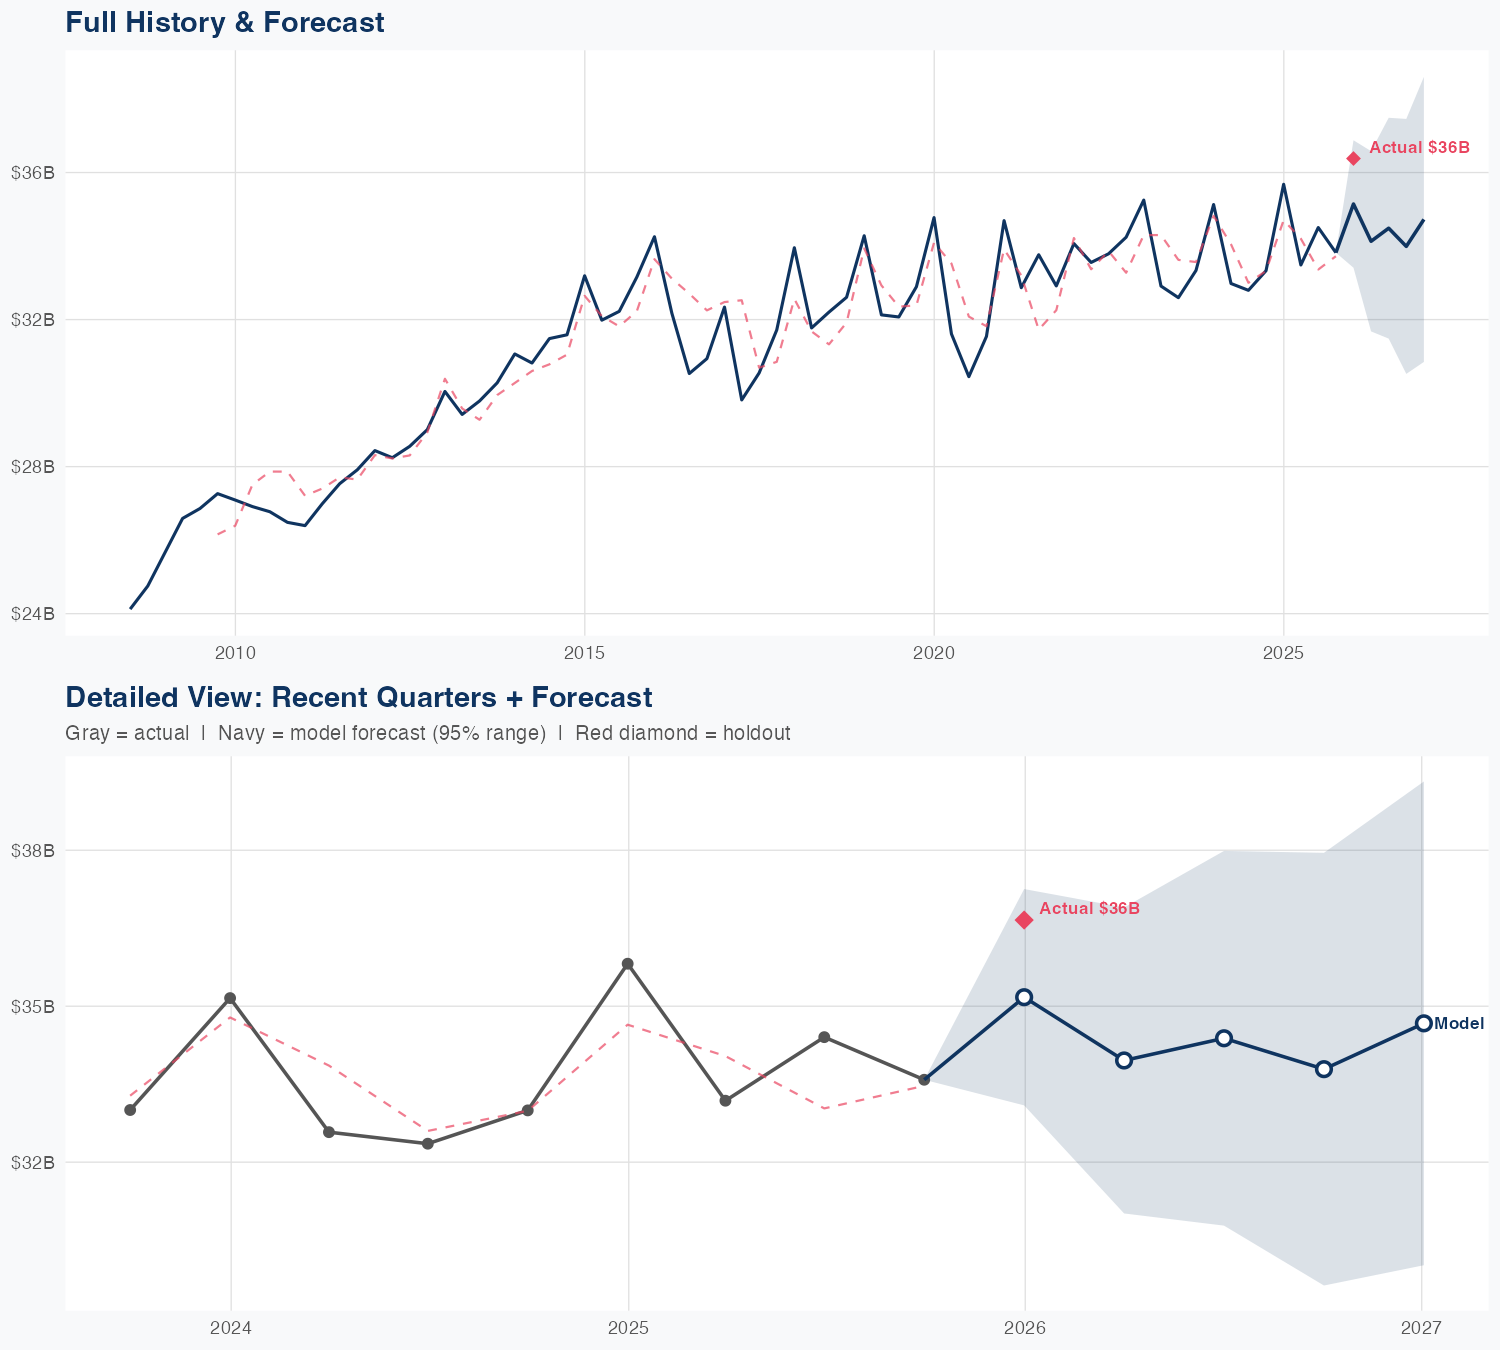
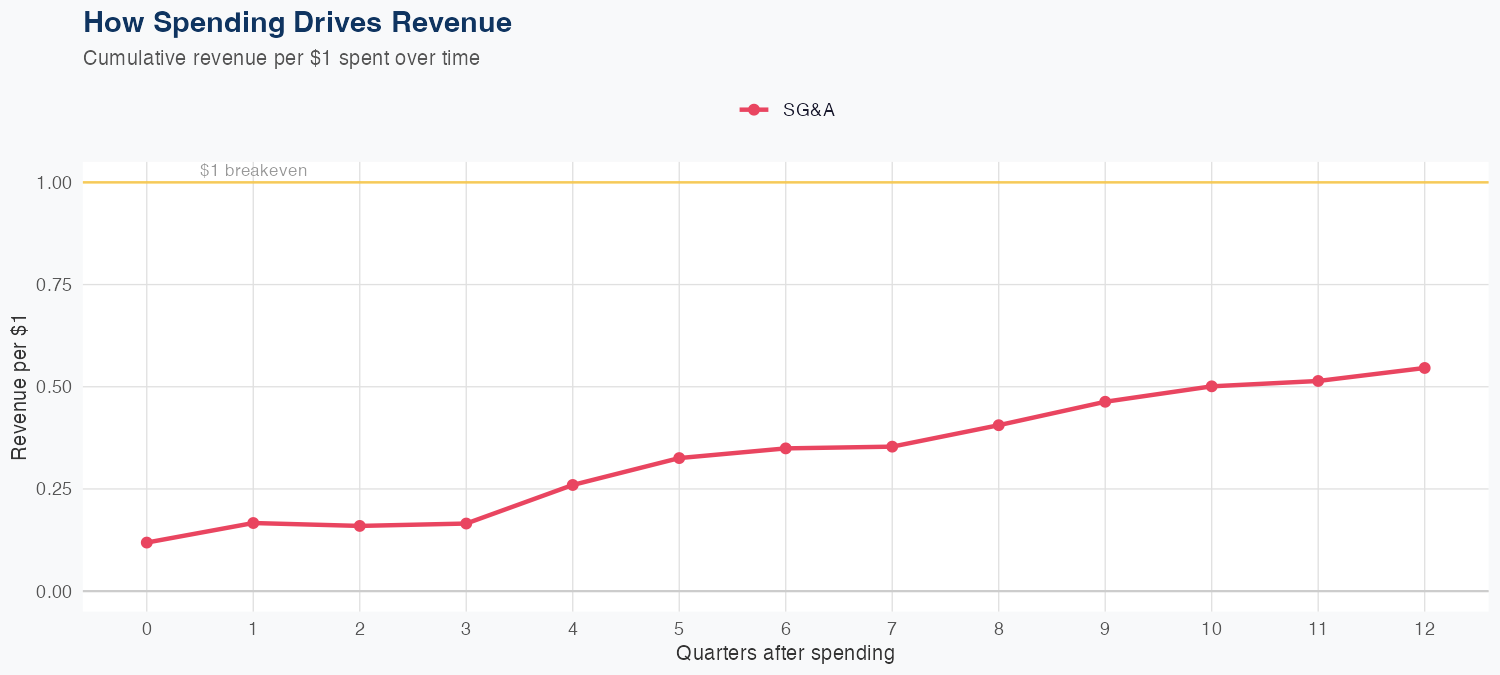
our econometric model shows Verizon's revenue is essentially flat (-0.6% YoY), with SG&A spending yielding a modest 0.55x ROI per dollar, implying growth will hinge on capex-driven network improvements rather than SG&A expansion. Holdout results show predicted $35.1B versus actual $36.4B, a -3.4% miss, suggesting the model underestimates some mix or demand components not captured in training data. MAPE of 2.2% over 70 quarters indicates generally reliable forecasting, but the holdout gap points to modest upside risk from device cycles or enterprise deals that the model may miss. Risks to growth include continued wireless pricing dynamics and a high capex base, which, if network upgrade returns disappoint or competition accelerates, could cap upside even as ARPU retention remains a driver.
Investment Thesis
Our ARDL model tracks Verizon Communications Inc.'s revenue with exceptional precision (2.2% MAPE), indicating highly predictable cash flows. Each $1 of SG&A spending generates $0.55 in revenue, reflecting strong commercial efficiency.
Revenue Forecast
Quarterly Detail
| Quarter | Model Forecast | Actual | 95% Range | YoY Growth | Status |
|---|---|---|---|---|---|
| Q4 2025 | $35B | $36B | $33B – $37B | -1.5% | ✓ In range |
| Q2 2026 | $34B | $32B – $37B | +1.9% | ||
| Q3 2026 | $34B | $31B – $37B | -0.1% | ||
| Q4 2026 | $34B | $31B – $37B | +0.5% | ||
| Q1 2027 | $35B | $31B – $39B | -4.6% |
Seasonal Factors
| Fiscal Quarter | Seasonal Factor | vs Trend | Interpretation | Obs. |
|---|---|---|---|---|
| FQ1 (Sep–Nov) | 1.0111 | +1.1% | In line with trend | 17 |
| FQ2 (Dec–Feb) | 1.0181 | +1.8% | In line with trend | 17 |
| FQ3 (Mar–May) | 0.9849 | -1.5% | In line with trend | 16 |
| FQ4 (Jun–Aug) | 0.9978 | -0.2% | In line with trend | 16 |
How Spending Drives Revenue
Want this analysis for your portfolio?
I build custom revenue intelligence reports for investors and companies using SEC filing data, econometric modeling, and AI-powered insights.
Get in Touch