Western Digital Corp WDC
Revenue Intelligence Report • 26 quarters of SEC filing data • Updated 2026-03-15
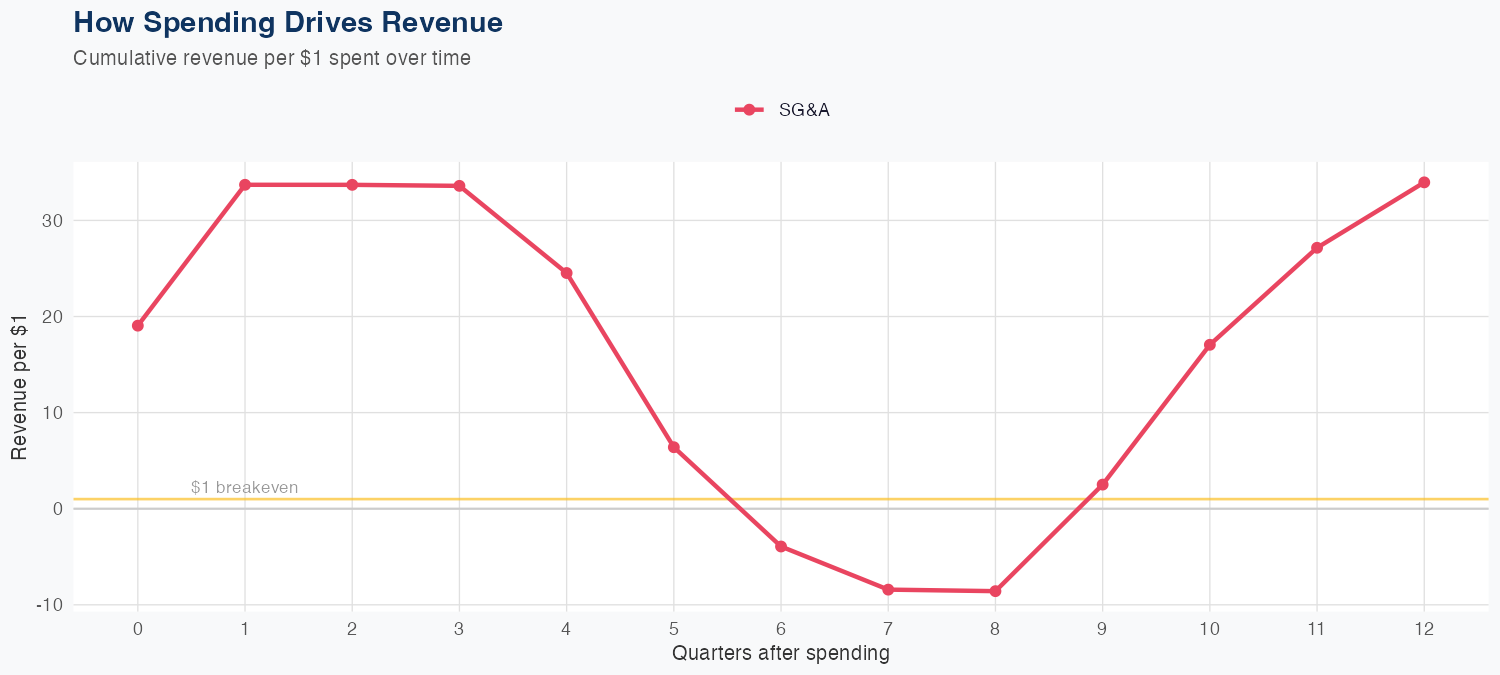
Latest quarterly revenue was $3.017B, with the model indicating SG&A spending efficiency as the key driver of long-run revenue since R&D data is not available. The model implies a long-run revenue of 33.96 for each $1 of SG&A, signaling a high ROI on SG&A spending as the main revenue lever. The holdout test predicted $2.4B versus actual $3.0B (21.9% error), and overall MAPE is 10.5%, signaling modest predictive accuracy and meaningful forecast risk. The FY forecast calls for $2.0B in revenue, down 81.1% year over year, indicating a materially weaker near-term outlook despite the SG&A ROI signal.
Investment Thesis
At 10.5% MAPE, the model captures Western Digital Corp's broad revenue trajectory, though quarterly variability suggests sensitivity to external factors. Each $1 of SG&A spending generates $33.96 in revenue, reflecting strong commercial efficiency.
Revenue Forecast
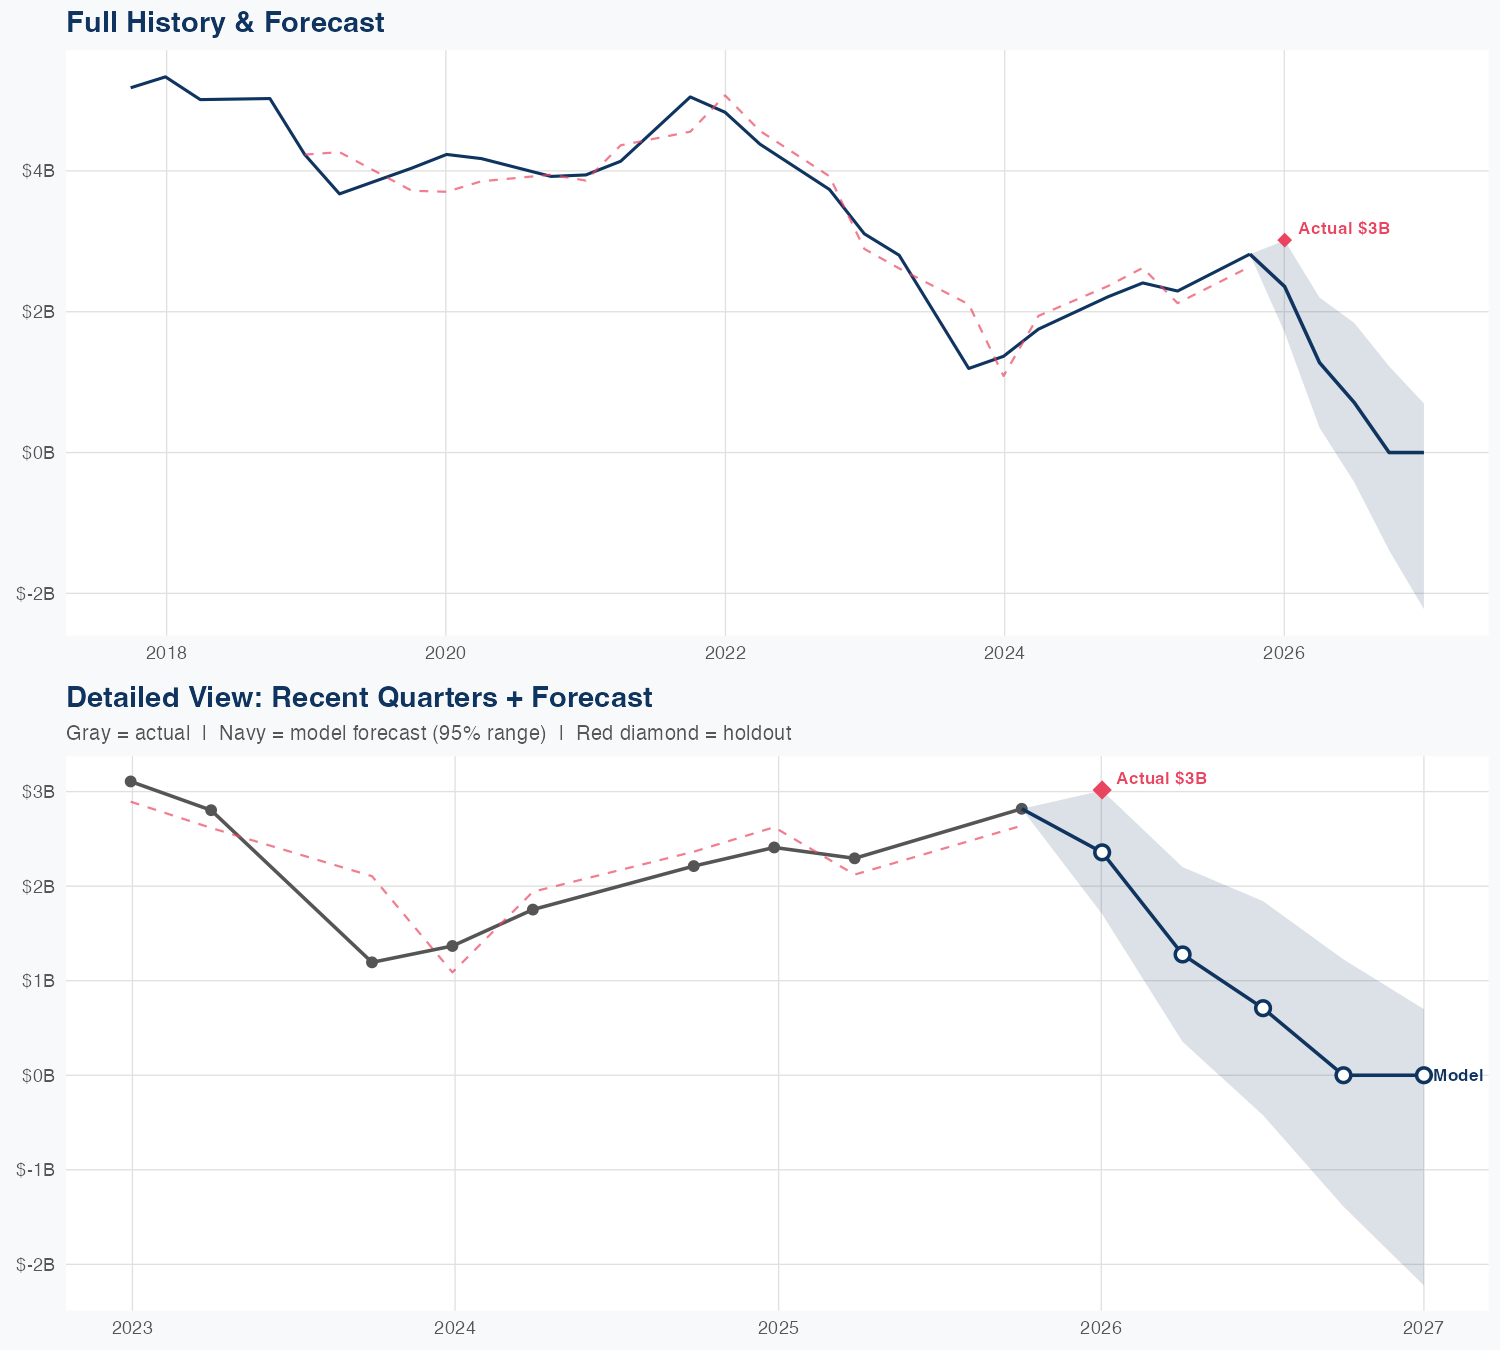
Quarterly Detail
| Quarter | Model Forecast | Actual | 95% Range | YoY Growth | Status |
|---|---|---|---|---|---|
| Q1 2026 | $2.4B | $3.0B | $1.7B – $3.0B | +6.6% | ✗ Outside range |
| Q2 2026 | $1.3B | $0.4B – $2.2B | -47.0% | ||
| Q3 2026 | $0.7B | $-0.4B – $1.8B | -69.1% | ||
| Q4 2026 | $0.0B | $-1.4B – $1.2B | -100.0% | ||
| Q1 2027 | $0.0B | $-2.2B – $0.7B | -100.0% |
Seasonal Factors
| Fiscal Quarter | Seasonal Factor | vs Trend | Interpretation | Obs. |
|---|---|---|---|---|
| FQ1 (Sep–Nov) | 0.9939 | -0.6% | In line with trend | 7 |
| FQ2 (Dec–Feb) | 1.0507 | +5.1% | +5.1% above trend | 8 |
| FQ3 (Mar–May) | 0.9587 | -4.1% | -4.1% below trend | 7 |
| FQ4 (Jun–Aug) | 1.0 | +0.0% | In line with trend | 0 |
How Spending Drives Revenue
Want this analysis for your portfolio?
I build custom revenue intelligence reports for investors and companies using SEC filing data, econometric modeling, and AI-powered insights.
Get in Touch