Agilent Technologies, Inc. A
Revenue Intelligence Report • 53 quarters of SEC filing data • Updated 2026-03-15
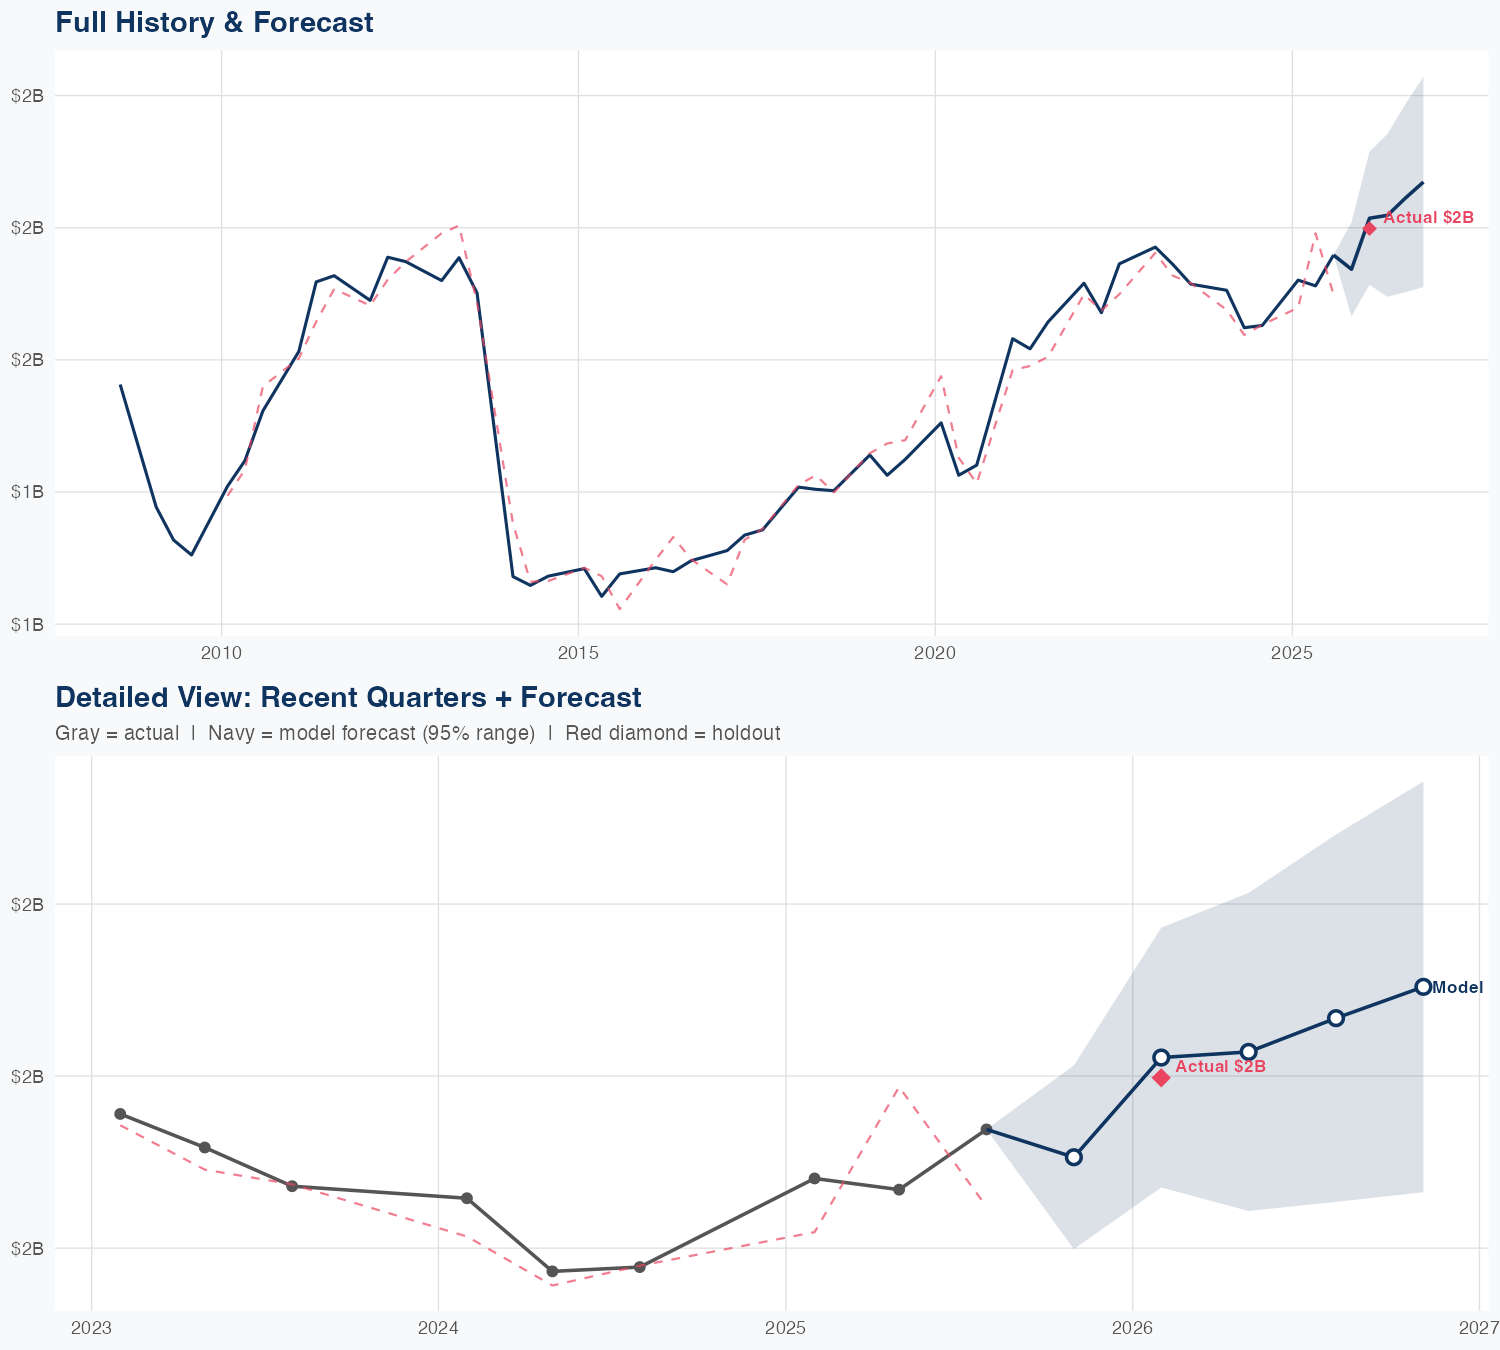
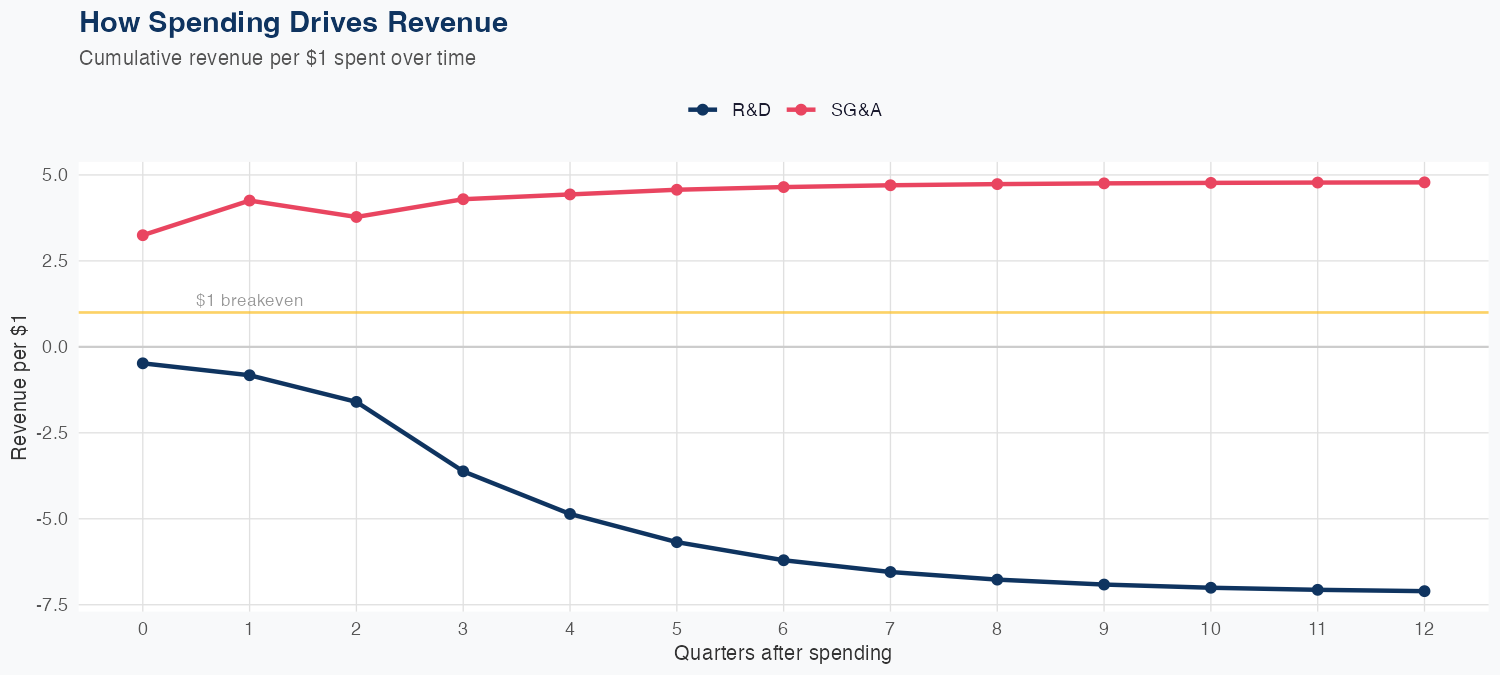
Under the model, SG&A spending is a positive driver of long-run revenue, with a ROI of about 4.78 in revenue per dollar, while R&D spending is modeled as a negative driver, subtracting roughly 7.10 in long-run revenue per dollar. The latest quarterly revenue came in at $1.798 billion. The holdout test produced a forecast of $1.7 billion versus actual $1.8 billion (5.1% error), with an overall MAPE of 3.0%. The FY revenue forecast is $7.4 billion, up 7.8% year over year, signaling continued growth but with a spend mix that emphasizes SG&A over R&D in this framework.
Investment Thesis
The econometric model achieves strong accuracy (3.0% MAPE), suggesting Agilent Technologies, Inc.'s revenue trajectory is well-characterized by its spending patterns. Each $1 of SG&A spending generates $4.78 in revenue, reflecting strong commercial efficiency.
Revenue Forecast
Quarterly Detail
| Quarter | Model Forecast | Actual | 95% Range | YoY Growth | Status |
|---|---|---|---|---|---|
| Q4 2025 | $1.7B | $1.8B | $1.6B – $1.8B | +8.1% | ✓ In range |
| Q1 2026 | $1.8B | $1.7B – $2.0B | +8.4% | ||
| Q2 2026 | $1.8B | $1.6B – $2.0B | +9.6% | ||
| Q3 2026 | $1.9B | $1.7B – $2.1B | +7.4% | ||
| Q4 2026 | $1.9B | $1.7B – $2.1B | +5.9% |
Seasonal Factors
| Fiscal Quarter | Seasonal Factor | vs Trend | Interpretation | Obs. |
|---|---|---|---|---|
| FQ1 (Sep–Nov) | 1.0 | +0.0% | In line with trend | 0 |
| FQ2 (Dec–Feb) | 1.0073 | +0.7% | In line with trend | 17 |
| FQ3 (Mar–May) | 0.9969 | -0.3% | In line with trend | 16 |
| FQ4 (Jun–Aug) | 1.011 | +1.1% | In line with trend | 16 |
How Spending Drives Revenue
Want this analysis for your portfolio?
I build custom revenue intelligence reports for investors and companies using SEC filing data, econometric modeling, and AI-powered insights.
Get in Touch