American International Group, Inc. AIG
Revenue Intelligence Report • 70 quarters of SEC filing data • Updated 2026-03-15
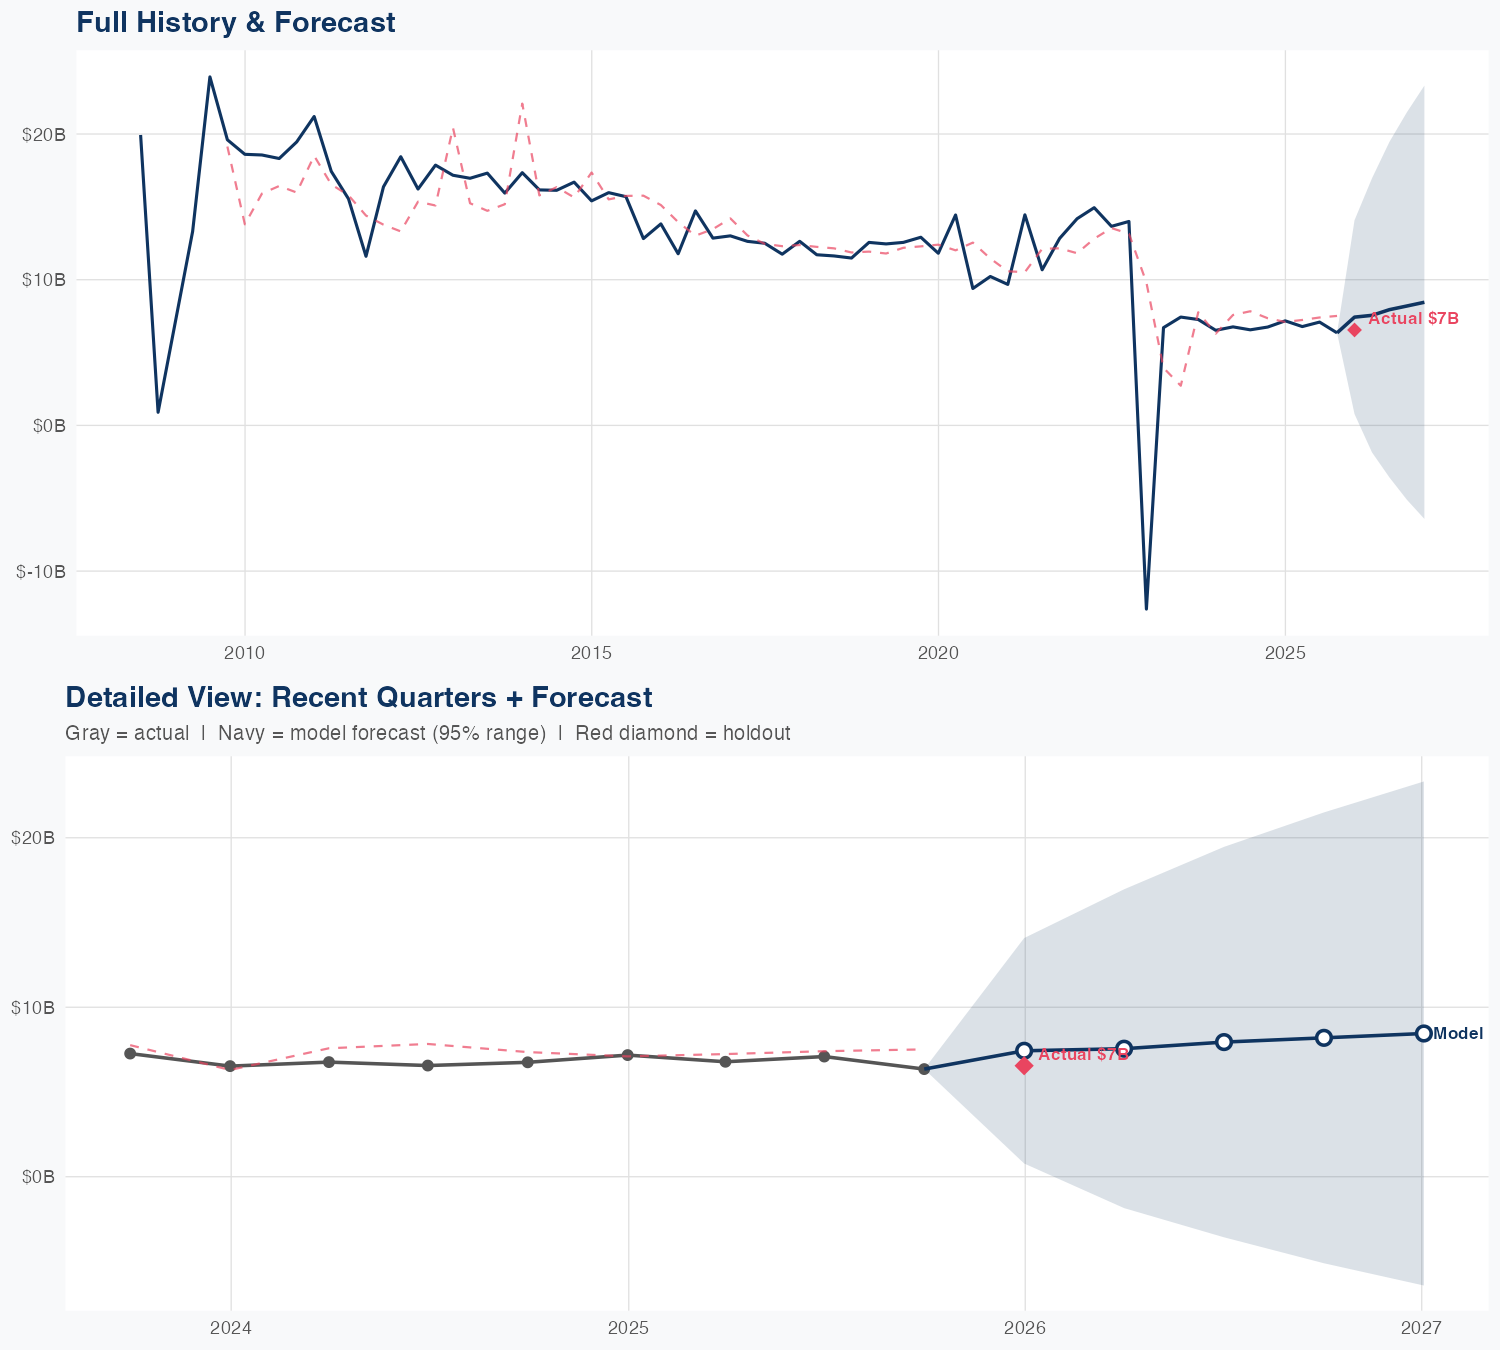
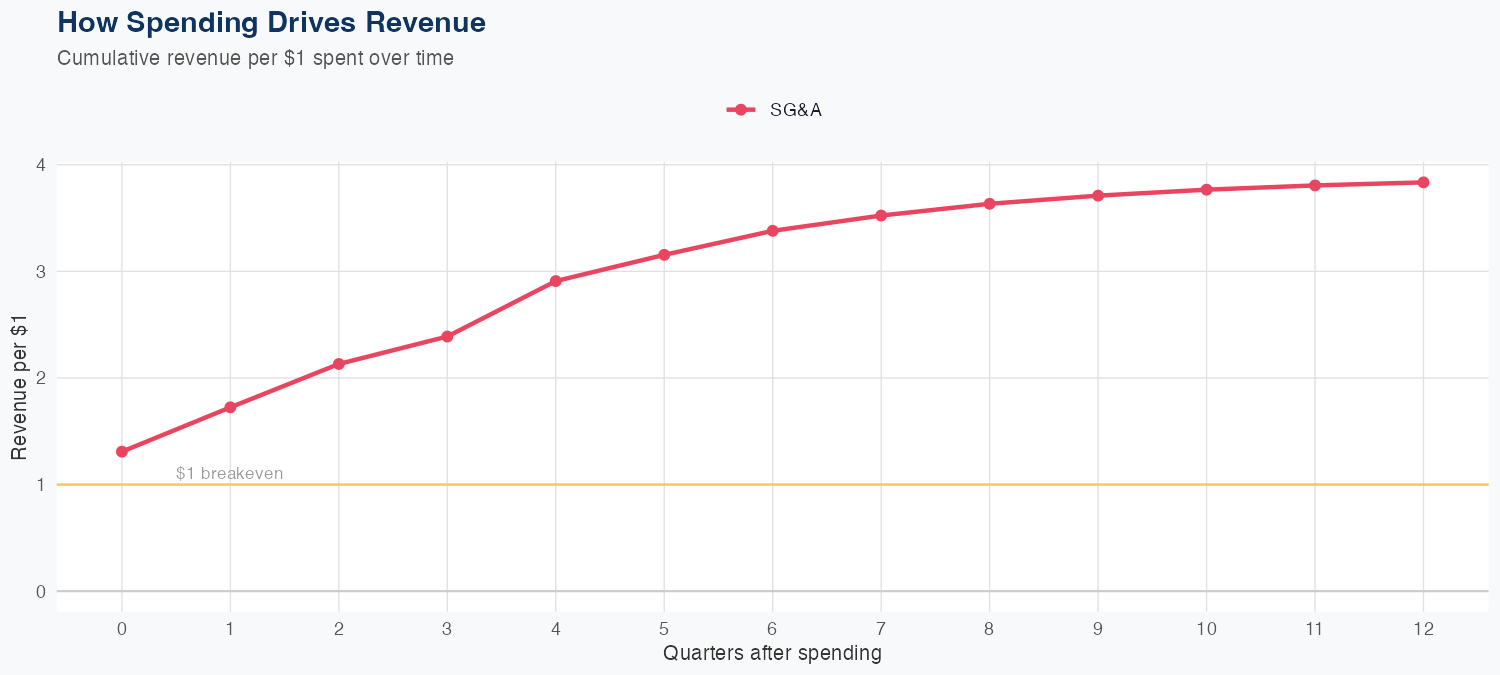
Based on 70 quarters of data, revenue growth appears driven by SG&A leverage, with every $1 of SG&A generating $3.83 in long-run revenue, though R&D data is not available. The model is linear with 14.2% MAPE, and a holdout test predicted $7.4B versus actual $6.5B (about -13.5% error), indicating moderate predictive reliability. Latest quarterly revenue stands at $6.55B, with a FY forecast of $32B in revenue, up 20.1% year over year. The outlook suggests continued SG&A-driven revenue acceleration, but model limitations and missing R&D data warrant a cautious stance on near-term volatility.
Investment Thesis
At 14.2% MAPE, the model captures American International Group, Inc.'s broad revenue trajectory, though quarterly variability suggests sensitivity to external factors. Each $1 of SG&A spending generates $3.83 in revenue, reflecting strong commercial efficiency.
Revenue Forecast
Quarterly Detail
| Quarter | Model Forecast | Actual | 95% Range | YoY Growth | Status |
|---|---|---|---|---|---|
| Q4 2025 | $7.4B | $6.5B | $0.8B – $14B | +3.5% | ✓ In range |
| Q2 2026 | $7.6B | $-1.9B – $17B | +11.4% | ||
| Q3 2026 | $7.9B | $-3.6B – $19B | +12.0% | ||
| Q4 2026 | $8.2B | $-5.1B – $21B | +29.0% | ||
| Q1 2027 | $8.5B | $-6.4B – $23B | +29.0% |
Seasonal Factors
| Fiscal Quarter | Seasonal Factor | vs Trend | Interpretation | Obs. |
|---|---|---|---|---|
| FQ1 (Sep–Nov) | 0.9677 | -3.2% | -3.2% below trend | 17 |
| FQ2 (Dec–Feb) | 0.9525 | -4.7% | -4.7% below trend | 17 |
| FQ3 (Mar–May) | 1.0558 | +5.6% | +5.6% above trend | 16 |
| FQ4 (Jun–Aug) | 1.0034 | +0.3% | In line with trend | 16 |
How Spending Drives Revenue
Want this analysis for your portfolio?
I build custom revenue intelligence reports for investors and companies using SEC filing data, econometric modeling, and AI-powered insights.
Get in Touch