Amcor Plc AMCR
Revenue Intelligence Report • 23 quarters of SEC filing data • Updated 2026-03-07
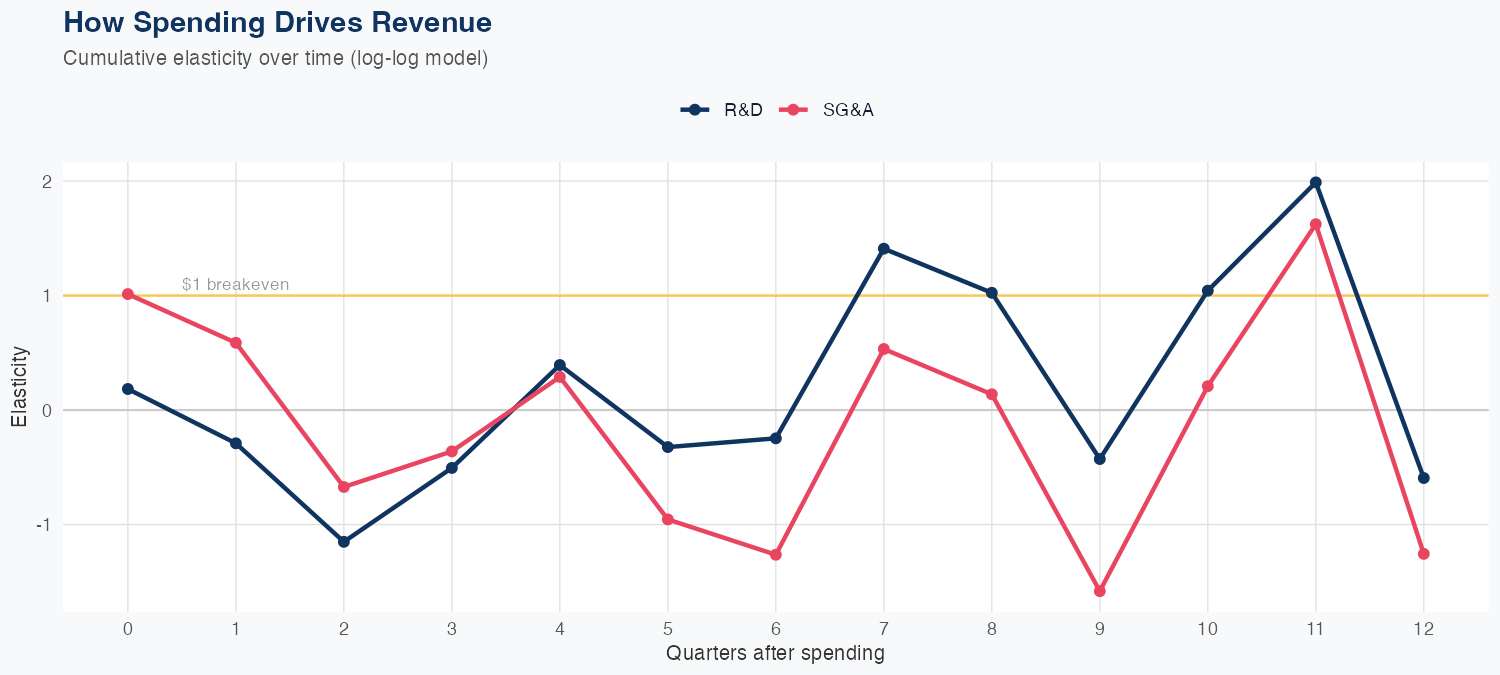
Amcor Plc's revenue is primarily influenced by its investments in R&D and SG&A, with elasticity metrics indicating that a 1% increase in R&D leads to a 0.59% decrease in revenue, while a similar increase in SG&A results in a 1.26% revenue decline. Despite a model accuracy of 1.1% MAPE, recent forecasts show a significant discrepancy, with predicted revenue of $4.344 billion falling short of the actual $5.449 billion, reflecting a 20.3% error in projections. Looking ahead, the company anticipates a revenue decline of 17.6% year-over-year, raising concerns about the revenue efficiency from its current spending strategies. Investors should closely monitor these trends as they assess the company's financial health and strategic direction.
Investment Thesis
Our ARDL model tracks Amcor Plc's revenue with exceptional precision (1.1% MAPE), indicating highly predictable cash flows. R&D spending currently shows a negative elasticity (-0.59x), which can indicate heavy investment in long-cycle initiatives not yet reflected in revenue.
Revenue Forecast
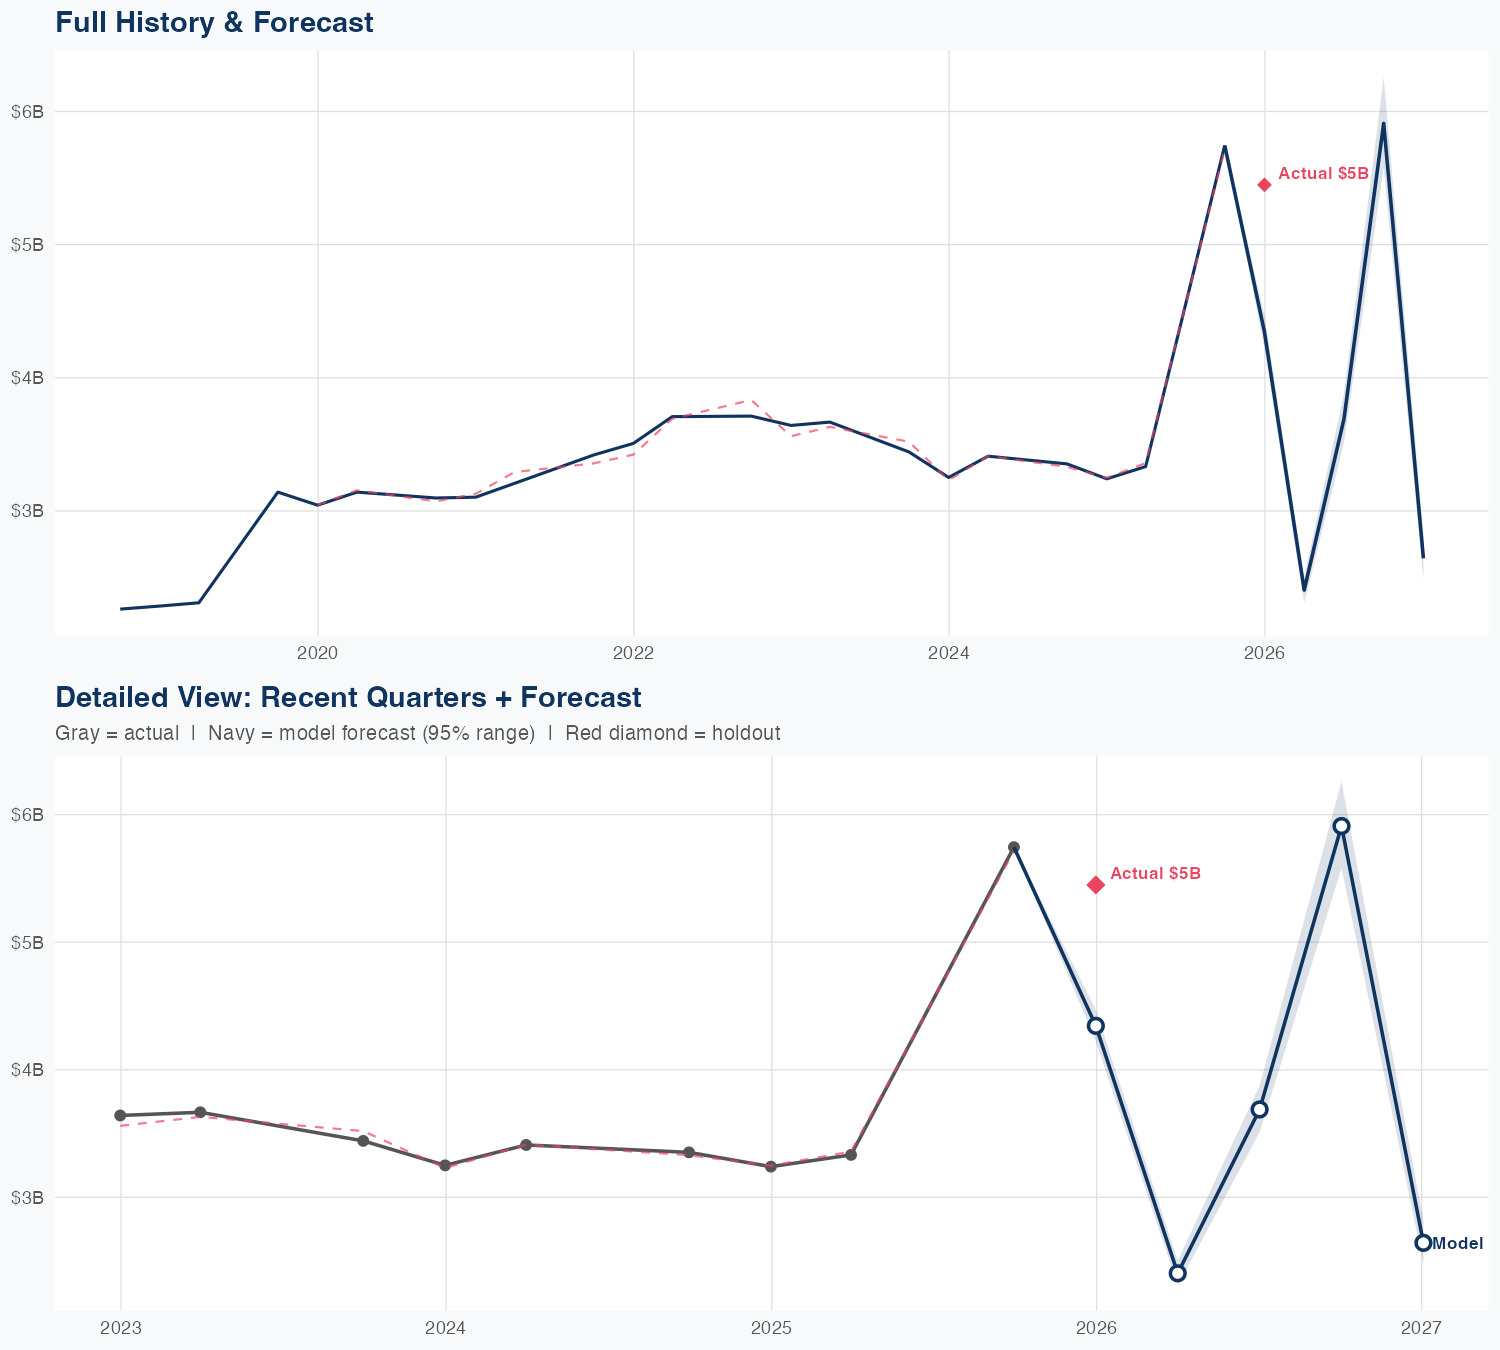
Quarterly Detail
| Quarter | Model Forecast | Actual | 95% Range | YoY Growth | Status |
|---|---|---|---|---|---|
| Q4 2025 | $4.3B | $5.4B | $4.2B – $4.5B | +29.6% | ✗ Outside range |
| Q2 2026 | $2.4B | $2.3B – $2.5B | -25.8% | ||
| Q3 2026 | $3.7B | $3.5B – $3.9B | +10.7% | ||
| Q4 2026 | $5.9B | $5.6B – $6.3B | +2.9% | ||
| Q1 2027 | $2.6B | $2.5B – $2.8B | -51.5% |
Seasonal Factors
| Fiscal Quarter | Seasonal Factor | vs Trend | Interpretation | Obs. |
|---|---|---|---|---|
| FQ1 (Sep–Nov) | 1.0066 | +0.7% | In line with trend | 6 |
| FQ2 (Dec–Feb) | 0.9995 | -0.0% | In line with trend | 7 |
| FQ3 (Mar–May) | 0.9995 | -0.1% | In line with trend | 6 |
| FQ4 (Jun–Aug) | 1.0 | +0.0% | In line with trend | 0 |
How Spending Drives Revenue
Want this analysis for your portfolio?
I build custom revenue intelligence reports for investors and companies using SEC filing data, econometric modeling, and AI-powered insights.
Get in Touch