Aptiv Plc APTV
Revenue Intelligence Report • 36 quarters of SEC filing data • Updated 2026-03-15
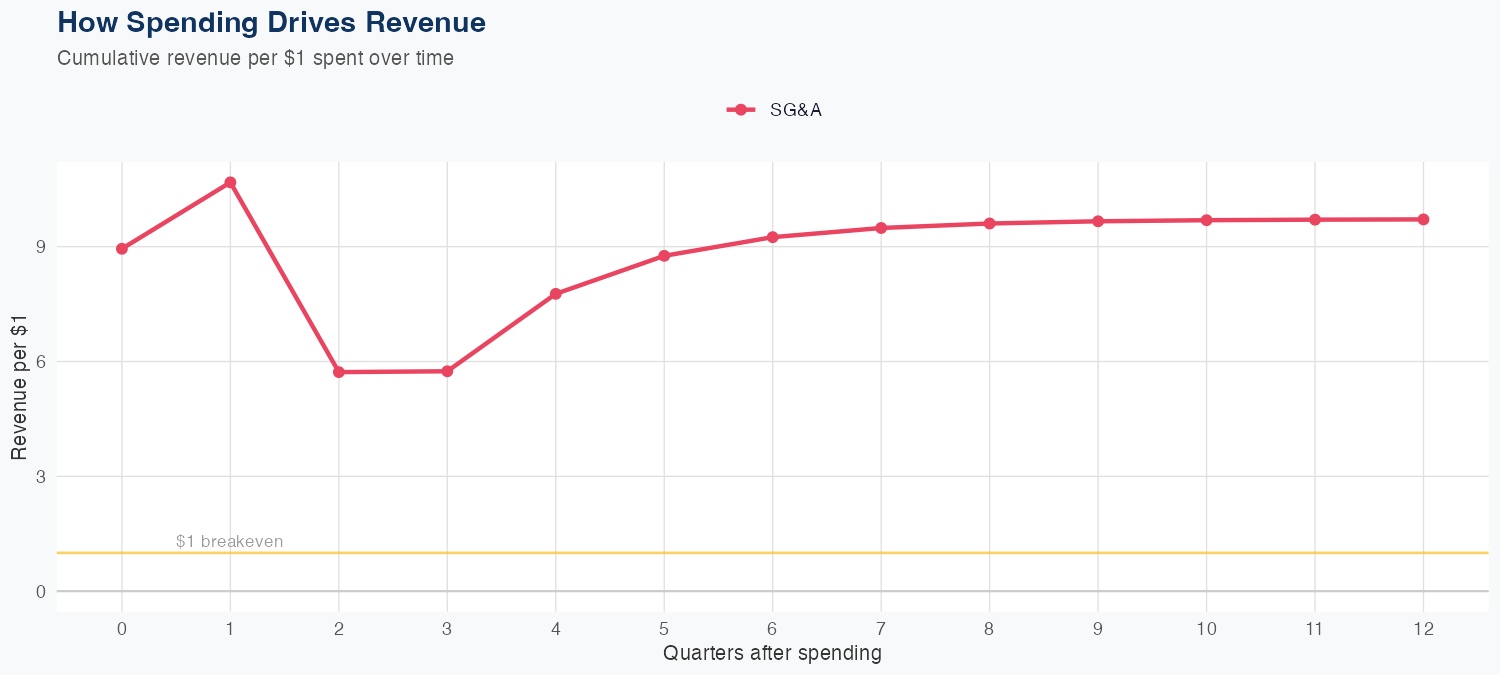
Revenue is driven by a linear relationship captured over 36 quarters, with the latest quarter posting about $5.15 billion and a stable growth pattern implied by the model. The SG&A spending shows strong leverage, with $1 of SG&A generating $9.71 of long-run revenue, indicating a high ROI on selling and administrative investments. The model’s holdout test is supportive, predicting $5.10B versus $5.20B actual (1.6% error), underscoring reasonable forecast reliability. The FY outlook calls for roughly $21B in revenue, up about 4.4% year over year, suggesting steady growth driven by efficient SG&A spending, though the lack of R&D data leaves some product development risk unquantified.
Investment Thesis
The econometric model achieves strong accuracy (6.1% MAPE), suggesting Aptiv Plc's revenue trajectory is well-characterized by its spending patterns. Each $1 of SG&A spending generates $9.71 in revenue, reflecting strong commercial efficiency.
Revenue Forecast
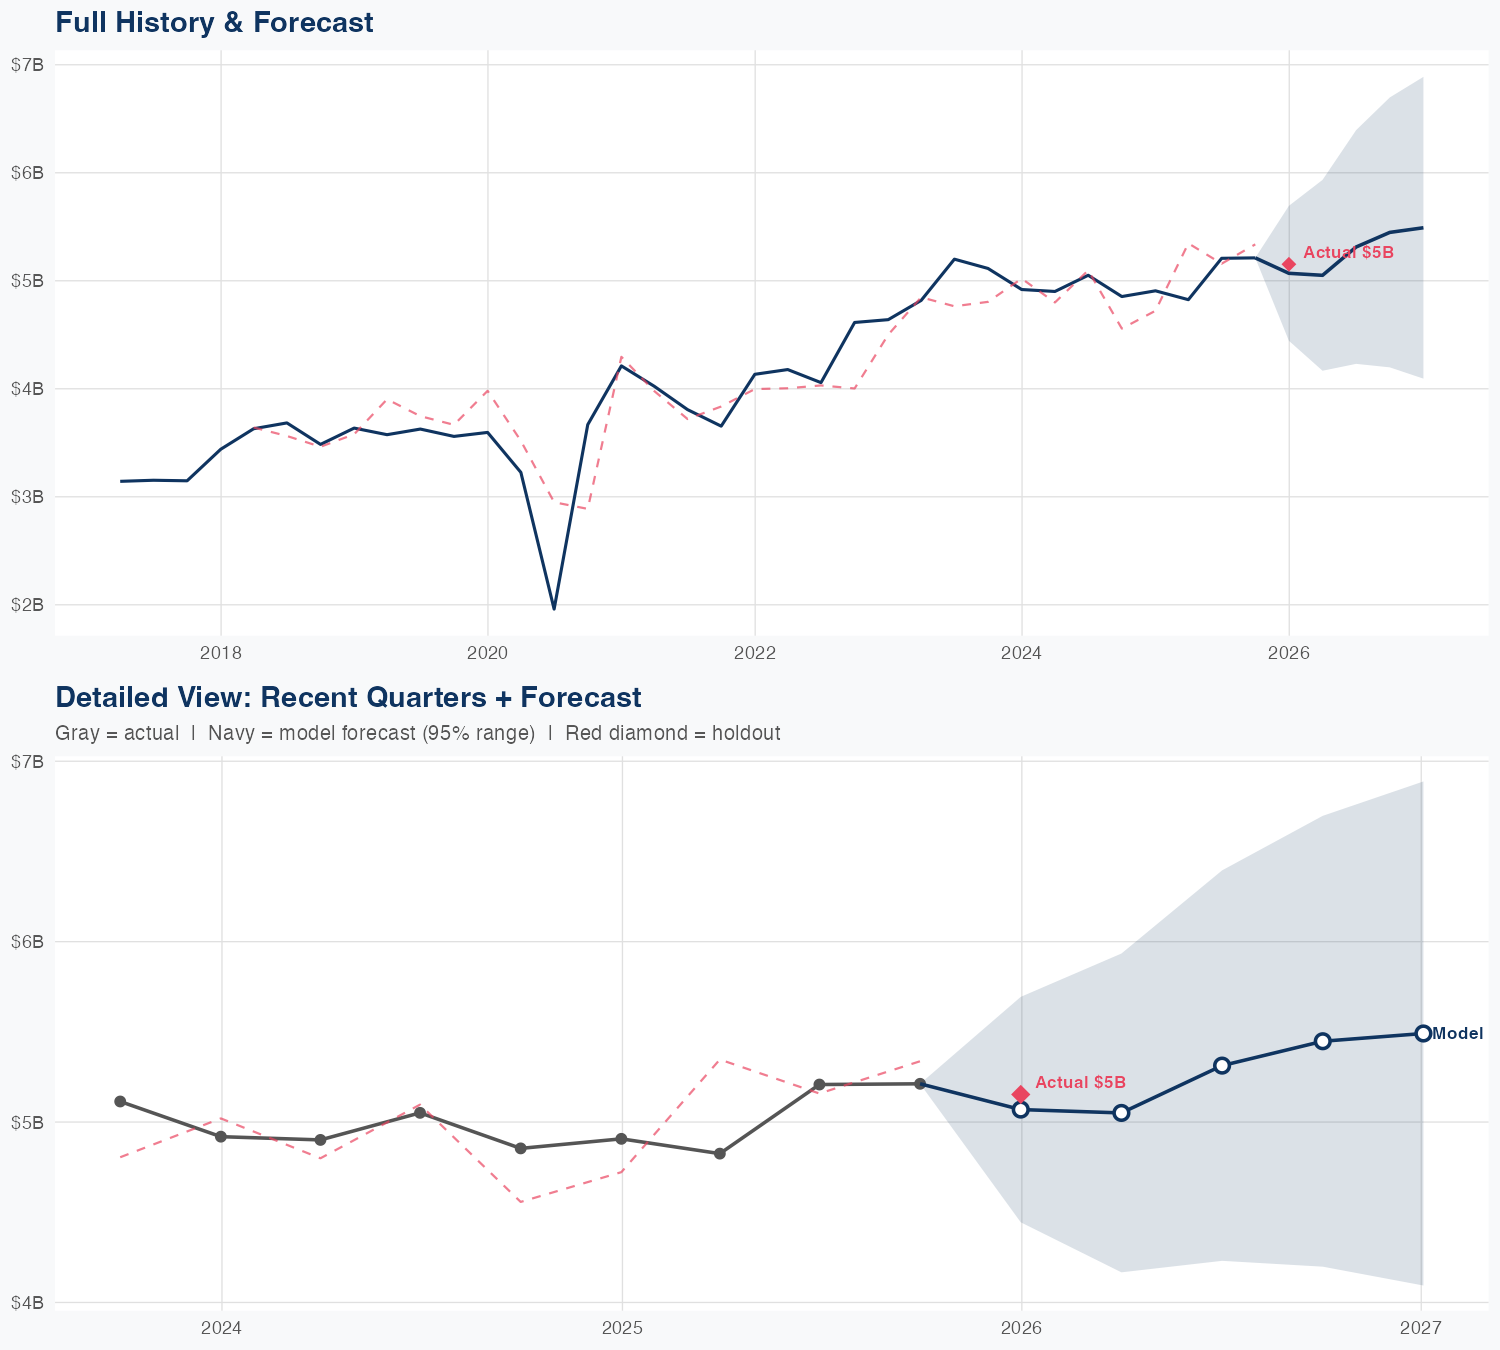
Quarterly Detail
| Quarter | Model Forecast | Actual | 95% Range | YoY Growth | Status |
|---|---|---|---|---|---|
| Q4 2025 | $5.1B | $5.2B | $4.4B – $5.7B | +3.3% | ✓ In range |
| Q2 2026 | $5.1B | $4.2B – $5.9B | +4.7% | ||
| Q3 2026 | $5.3B | $4.2B – $6.4B | +2.0% | ||
| Q4 2026 | $5.4B | $4.2B – $6.7B | +4.5% | ||
| Q1 2027 | $5.5B | $4.1B – $6.9B | +6.6% |
Seasonal Factors
| Fiscal Quarter | Seasonal Factor | vs Trend | Interpretation | Obs. |
|---|---|---|---|---|
| FQ1 (Sep–Nov) | 1.0643 | +6.4% | +6.4% above trend | 8 |
| FQ2 (Dec–Feb) | 1.0159 | +1.6% | In line with trend | 8 |
| FQ3 (Mar–May) | 0.9968 | -0.3% | In line with trend | 8 |
| FQ4 (Jun–Aug) | 1.0097 | +1.0% | In line with trend | 8 |
How Spending Drives Revenue
Want this analysis for your portfolio?
I build custom revenue intelligence reports for investors and companies using SEC filing data, econometric modeling, and AI-powered insights.
Get in Touch