Ares Management Corporation ARES
Revenue Intelligence Report • 21 quarters of SEC filing data • Updated 2026-03-15
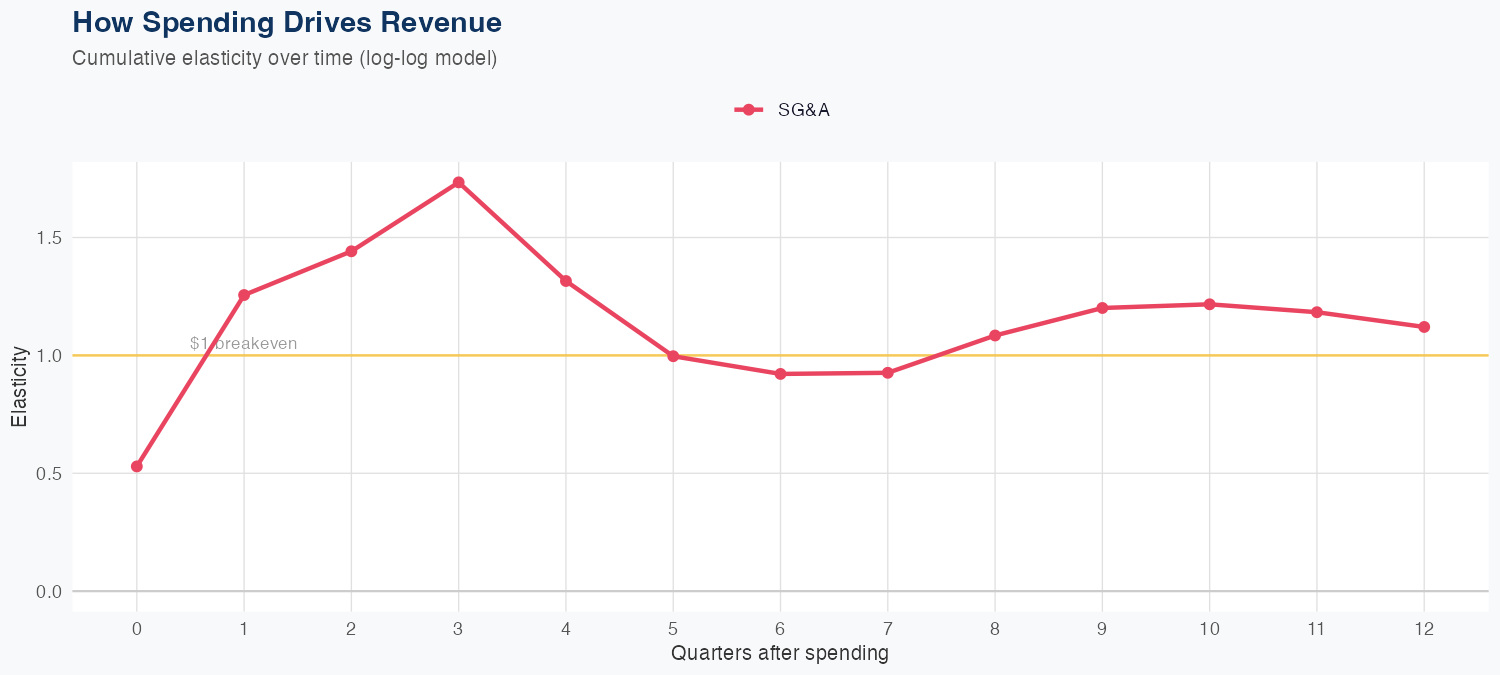
Revenue is driven by fee-based asset management activities, with the latest quarterly revenue at 1.558 billion and a 21-quarter data history supporting a linear growth view. The ROI on SG&A spending appears strong in the model, with each dollar of SG&A generating 2.91 dollars in long-run revenue, indicating efficient operating spend. The forecasting model is linear with a 6.8% MAPE and a holdout test error of 11.6% (1.4B predicted vs 1.6B actual), signaling reasonably accurate but imperfect predictability. The FY outlook calls for 5.5B in revenue, up 15.7% year over year, suggesting solid growth driven by continued SG&A efficiency and favorable market conditions.
Investment Thesis
The econometric model achieves strong accuracy (6.8% MAPE), suggesting Ares Management Corporation's revenue trajectory is well-characterized by its spending patterns. Each $1 of SG&A spending generates $2.91 in revenue, reflecting strong commercial efficiency.
Revenue Forecast
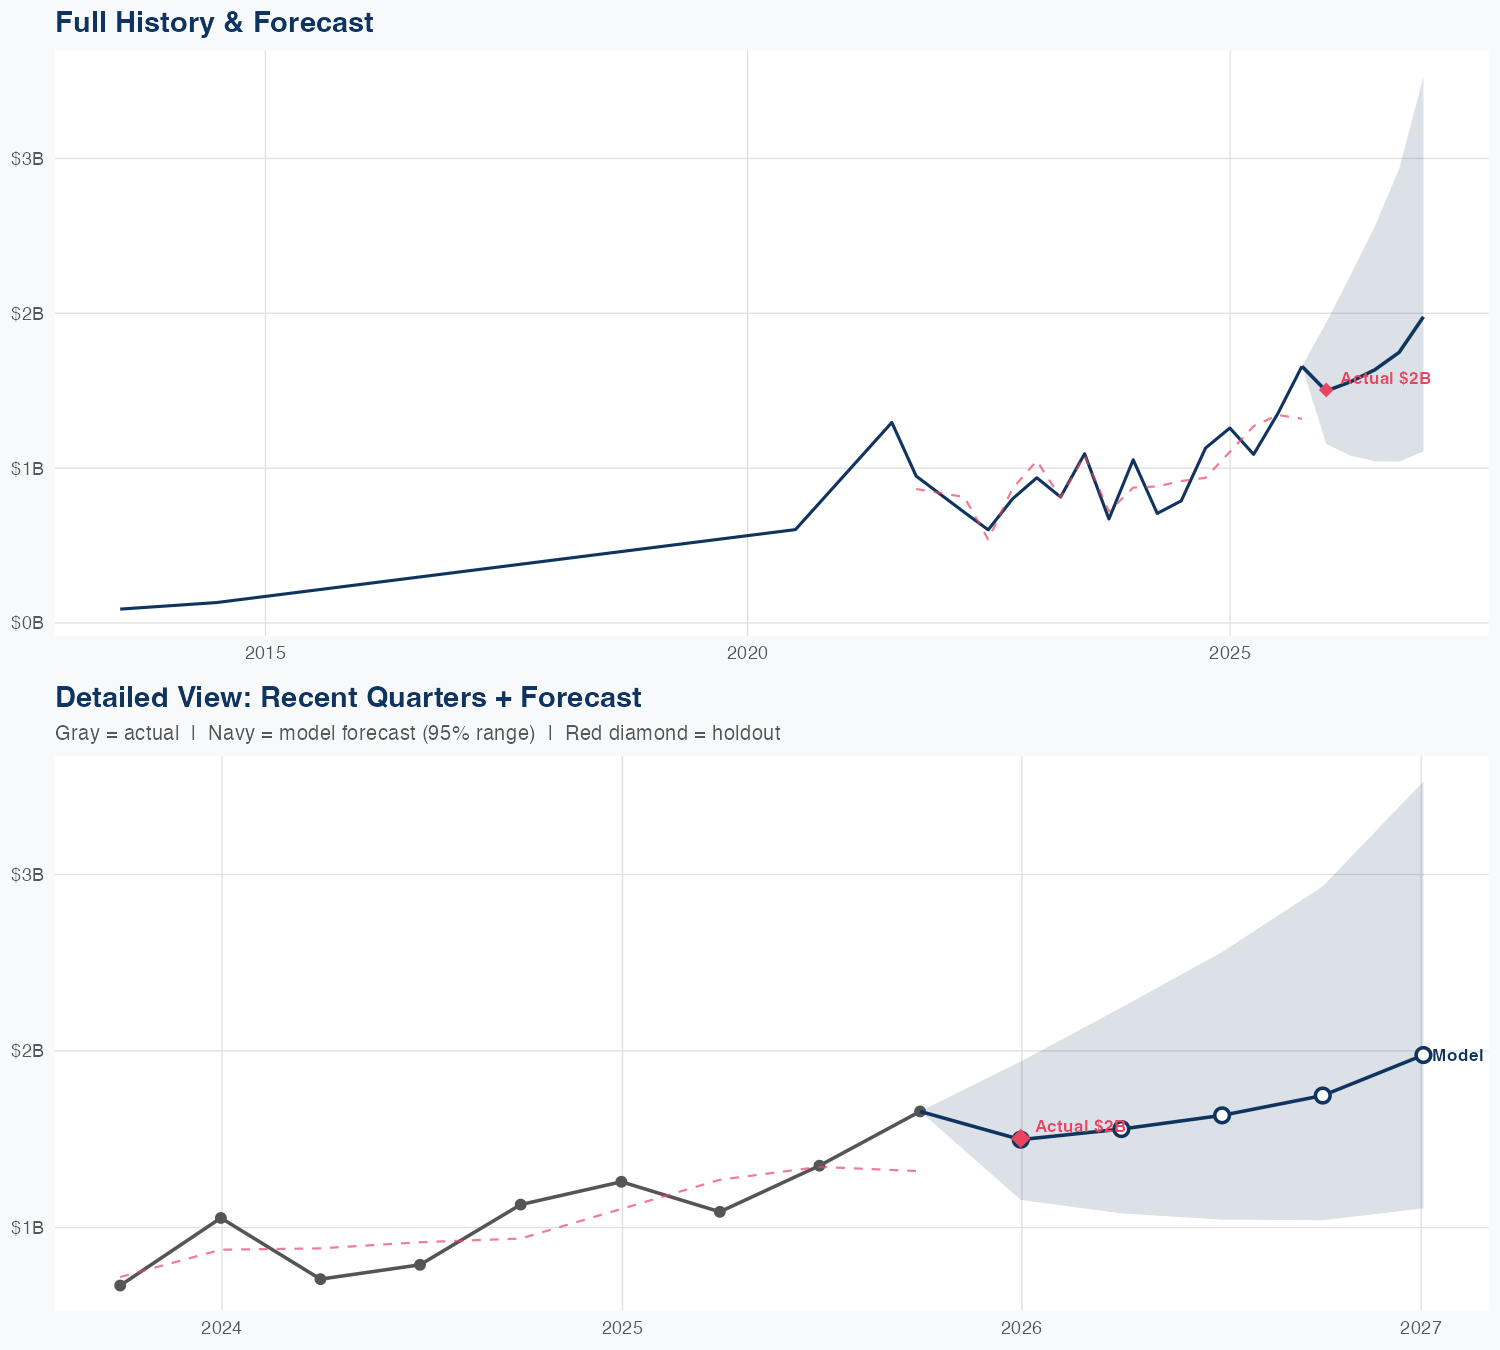
Quarterly Detail
| Quarter | Model Forecast | Actual | 95% Range | YoY Growth | Status |
|---|---|---|---|---|---|
| Q4 2025 | $1.4B | $1.6B | $1.2B – $1.5B | +11.2% | ✗ Outside range |
| Q2 2026 | $1.3B | $1.1B – $1.5B | +26.7% | ||
| Q3 2026 | $1.3B | $1.0B – $1.5B | +23.1% | ||
| Q4 2026 | $1.4B | $1.1B – $1.7B | +21.1% | ||
| Q1 2027 | $1.6B | $1.2B – $1.9B | -0.3% |
Seasonal Factors
| Fiscal Quarter | Seasonal Factor | vs Trend | Interpretation | Obs. |
|---|---|---|---|---|
| FQ1 (Sep–Nov) | 1.0255 | +2.6% | In line with trend | 5 |
| FQ2 (Dec–Feb) | 1.0448 | +4.5% | +4.5% above trend | 4 |
| FQ3 (Mar–May) | 1.0137 | +1.4% | In line with trend | 4 |
| FQ4 (Jun–Aug) | 1.0126 | +1.3% | In line with trend | 4 |
How Spending Drives Revenue
Want this analysis for your portfolio?
I build custom revenue intelligence reports for investors and companies using SEC filing data, econometric modeling, and AI-powered insights.
Get in Touch