Boeing Co BA
Revenue Intelligence Report • 70 quarters of SEC filing data • Updated 2026-03-15
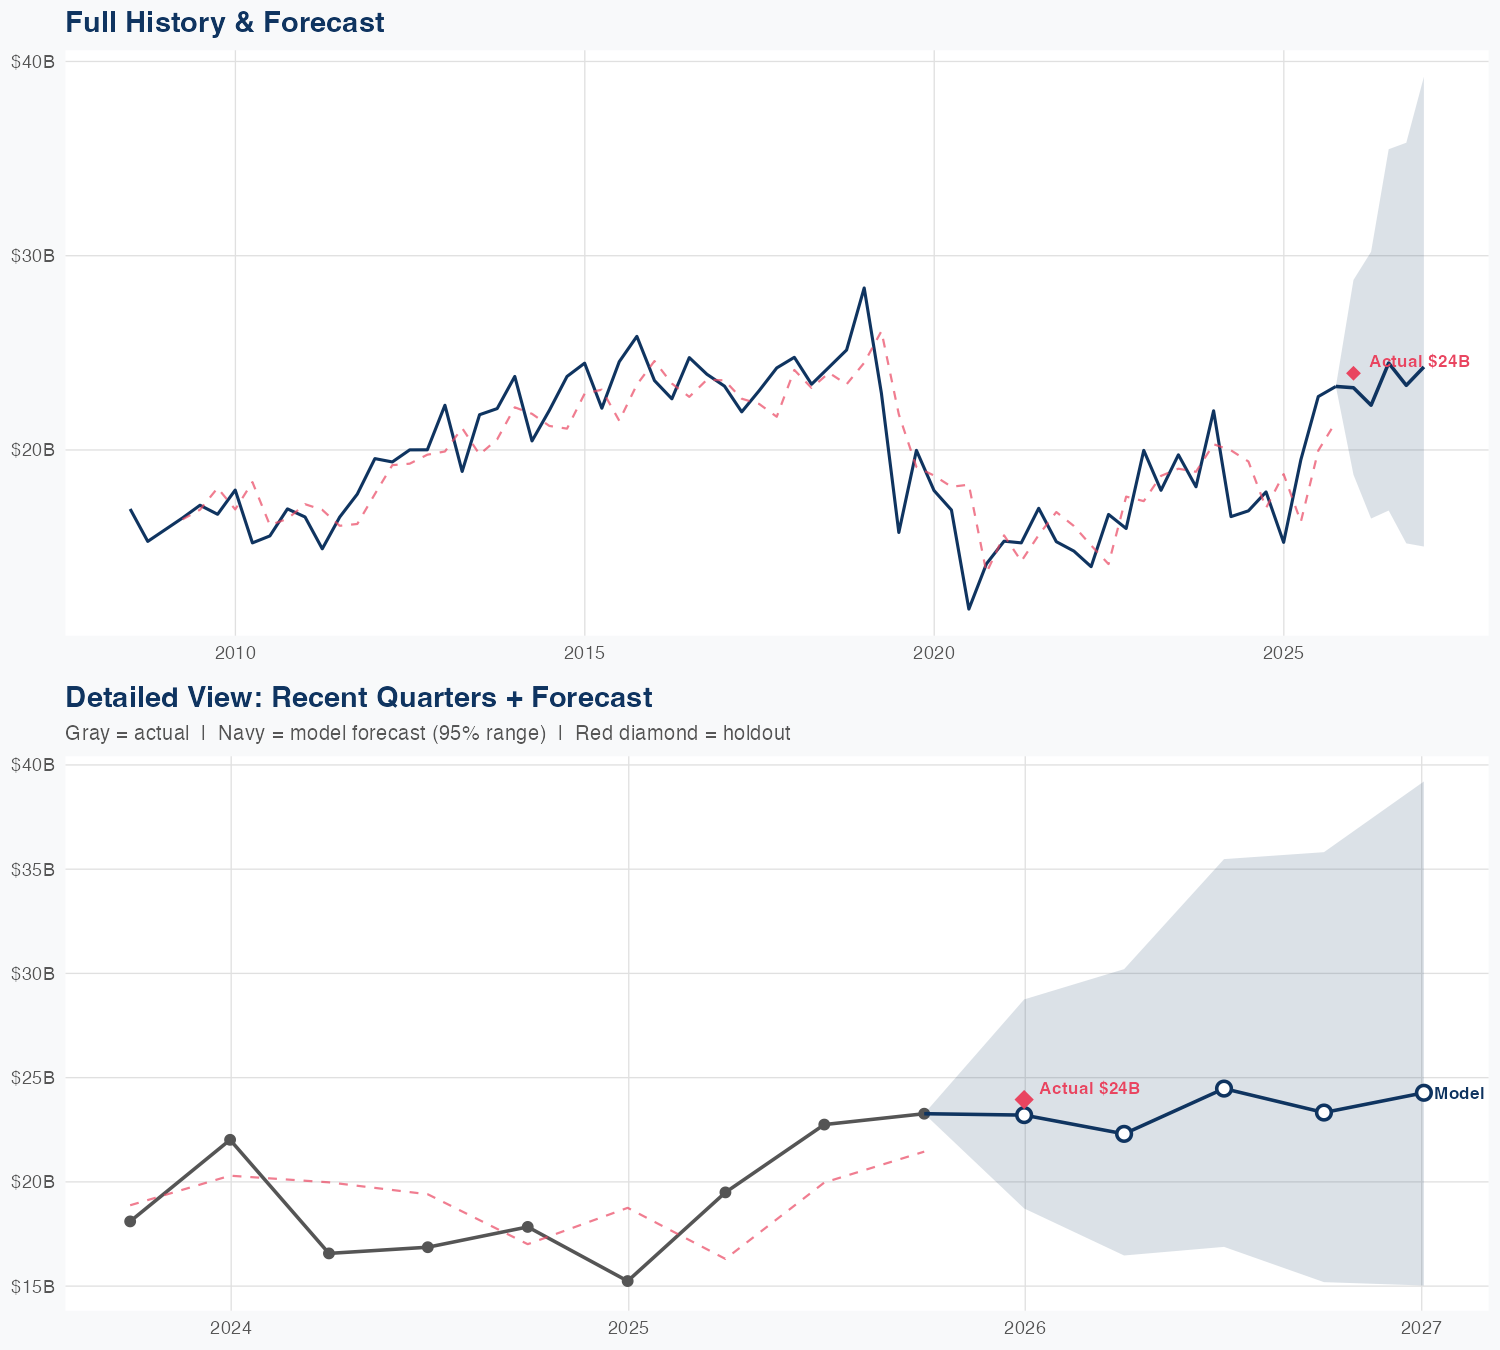
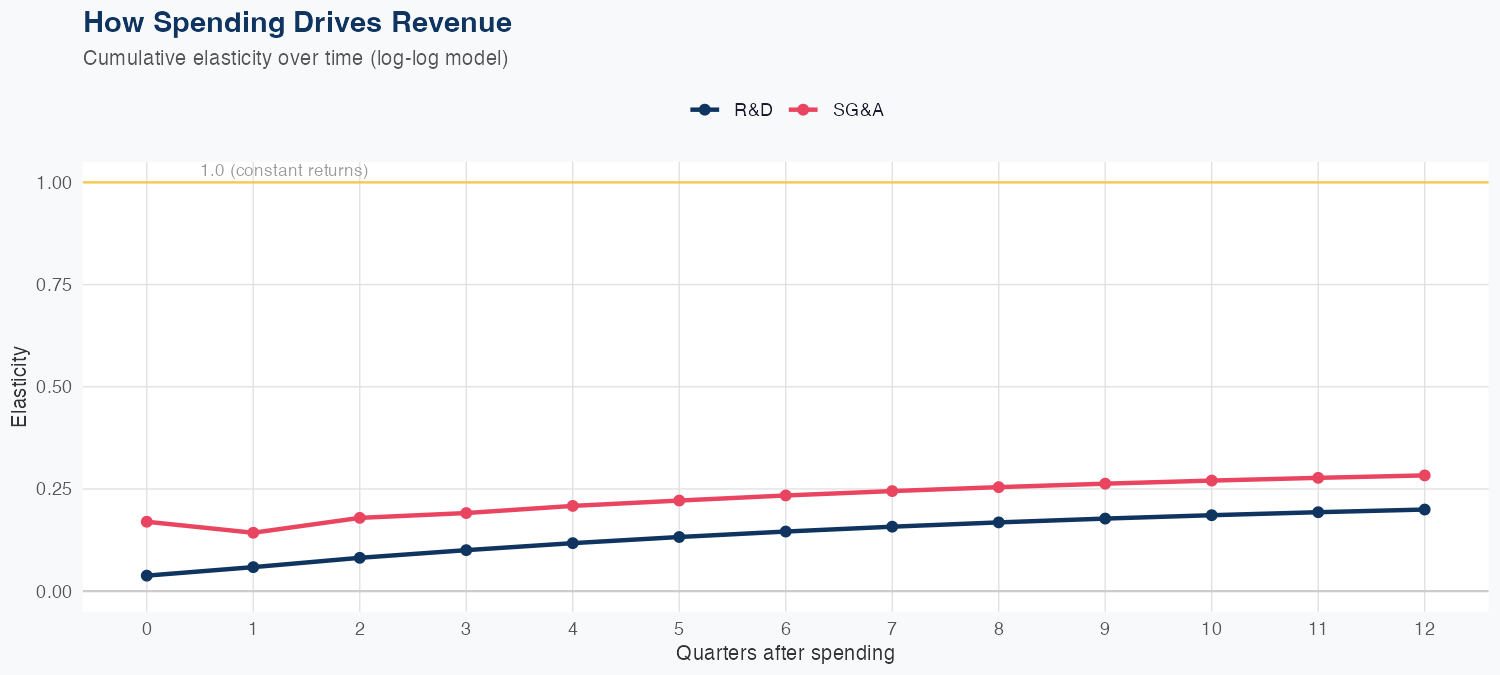
Our econometric model suggests Boeing’s revenue growth is not being driven by outsized R&D or SG&A spend. With R&D elasticity at 0.20x and SG&A elasticity at 0.28x, a 1% rise in R&D or SG&A yields only about 0.2%–0.3% more revenue, implying growth is coming mainly from higher delivery volumes, backlog execution and mix (including services), rather than product development push. The holdout forecast of $23.1B versus actual $23.9B implies roughly a 3.5% underprediction, signaling modest model bias but some upside not captured—potentially defense wins or services strength. The 8.5% MAPE points to reasonable but not tight forecast reliability in a long-cycle, lumpier business; risks to growth include slower airframe deliveries, supply-chain disruptions, and defense budget shifts that could temper the 5% YoY trajectory and pressure margins if ramp rates falter.
Investment Thesis
At 8.5% MAPE, the model captures Boeing Co's broad revenue trajectory, though quarterly variability suggests sensitivity to external factors. R&D investment shows a 0.20x multiplier — each 1% increase in R&D spend is associated with a 0.20% revenue increase, signaling strong innovation-to-revenue conversion. Sales & marketing spend shows a 0.28x elasticity, suggesting effective go-to-market execution.
Revenue Forecast
Quarterly Detail
| Quarter | Model Forecast | Actual | 95% Range | YoY Growth | Status |
|---|---|---|---|---|---|
| Q4 2025 | $23B | $24B | $19B – $29B | +51.6% | ✓ In range |
| Q2 2026 | $23B | $17B – $32B | +19.6% | ||
| Q3 2026 | $23B | $16B – $34B | +2.9% | ||
| Q4 2026 | $24B | $15B – $36B | +1.2% | ||
| Q1 2027 | $24B | $15B – $38B | -1.1% |
Seasonal Factors
| Fiscal Quarter | Seasonal Factor | vs Trend | Interpretation | Obs. |
|---|---|---|---|---|
| FQ1 (Sep–Nov) | 1.0448 | +4.5% | +4.5% above trend | 17 |
| FQ2 (Dec–Feb) | 1.027 | +2.7% | In line with trend | 17 |
| FQ3 (Mar–May) | 0.9587 | -4.1% | -4.1% below trend | 17 |
| FQ4 (Jun–Aug) | 1.0369 | +3.7% | +3.7% above trend | 17 |
How Spending Drives Revenue
Want this analysis for your portfolio?
I build custom revenue intelligence reports for investors and companies using SEC filing data, econometric modeling, and AI-powered insights.
Get in Touch