Becton, Dickinson and Company BDX
Revenue Intelligence Report • 46 quarters of SEC filing data • Updated 2026-03-15
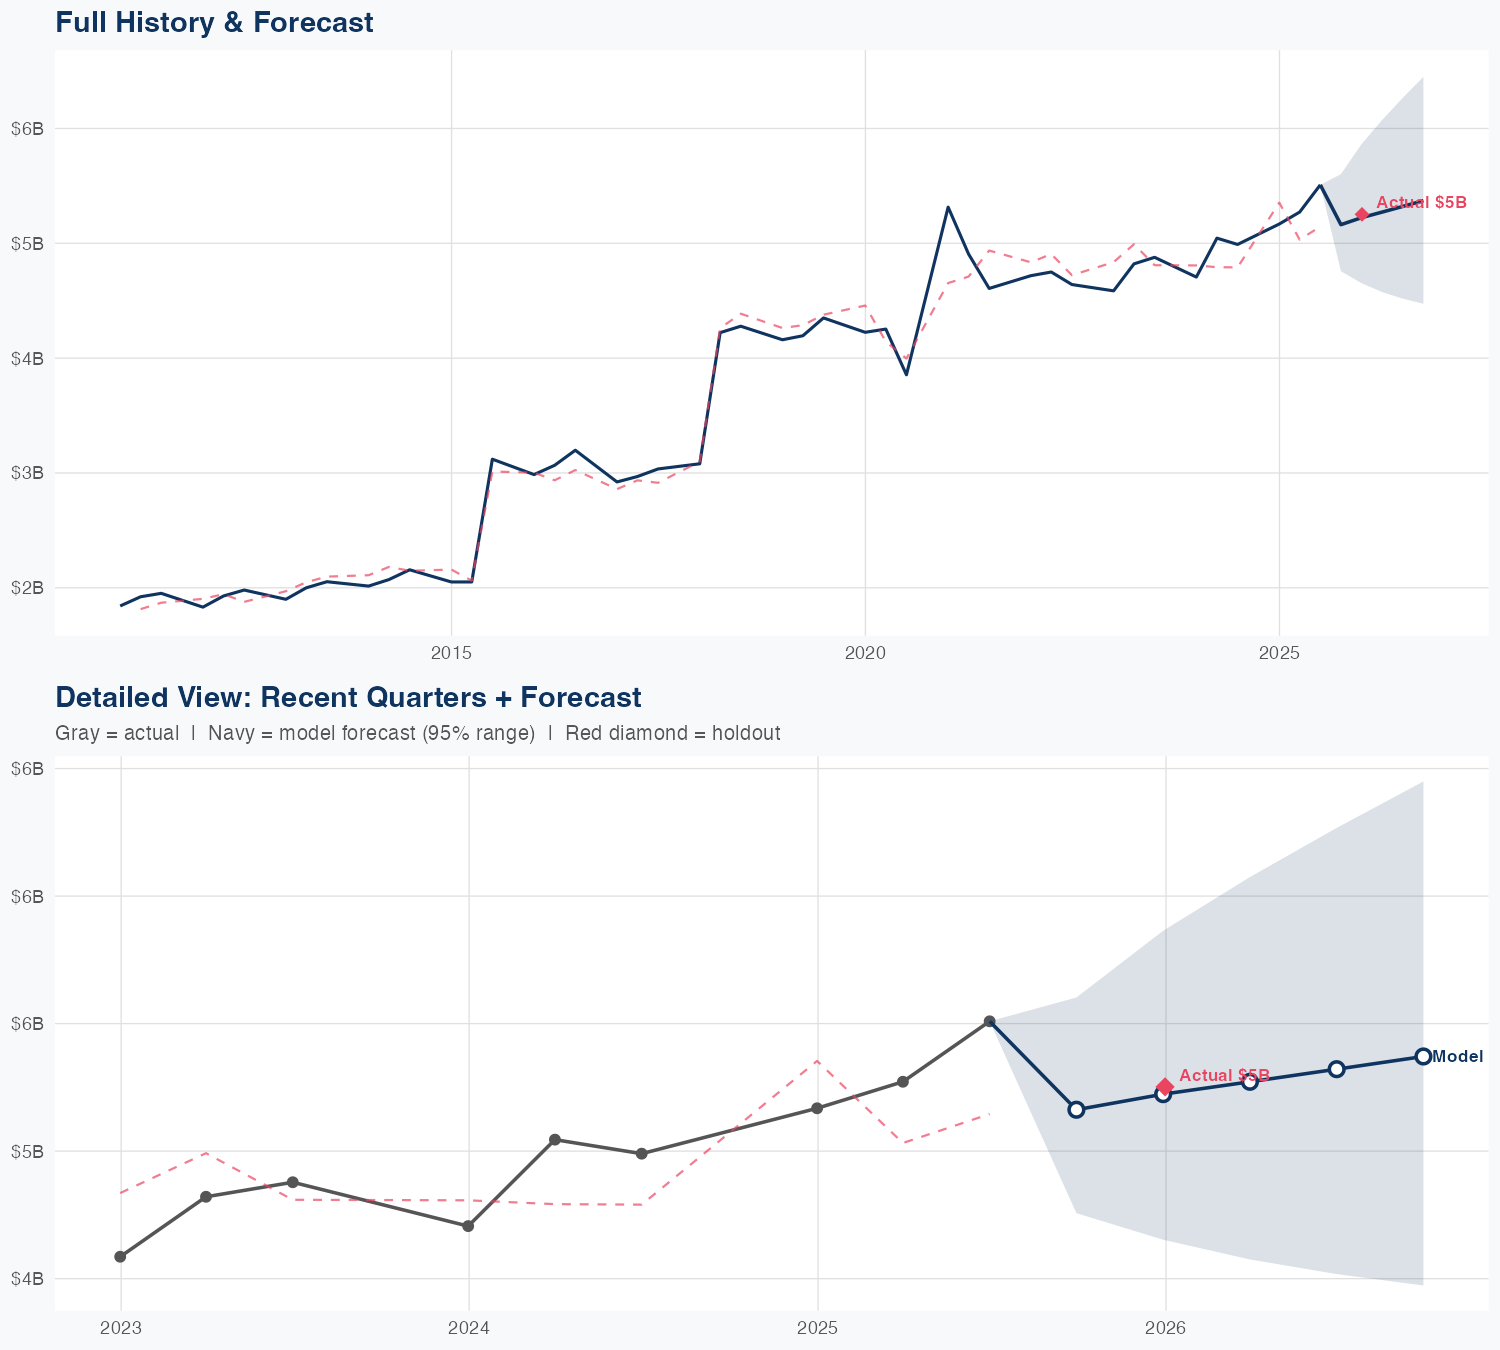
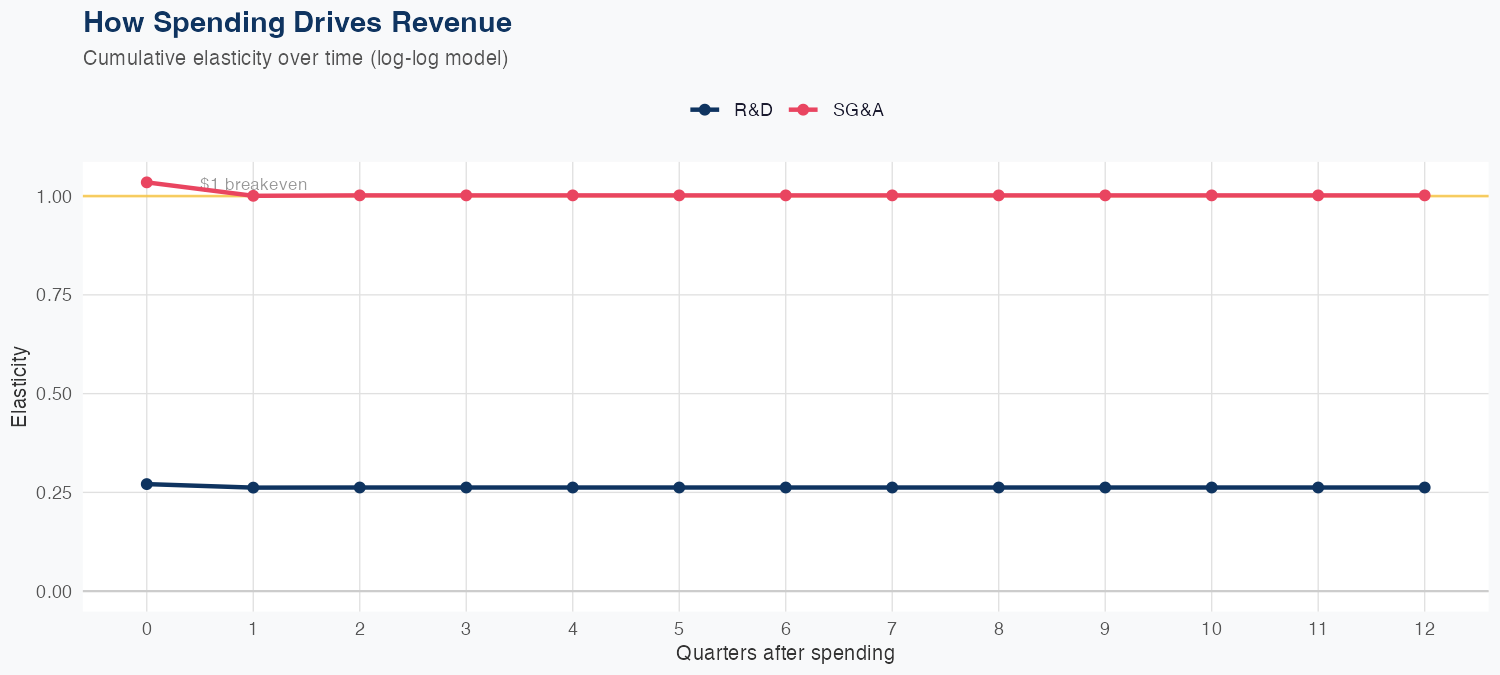
Revenue growth is driven predominantly by SG&A spending, which the model ties to a 1.00 elasticity (a 1% SG&A increase yields roughly a 1% revenue gain), while R&D shows a more modest 0.26 elasticity. The log-log model fits across 46 quarters with solid predictive performance: a holdout forecast of $5.2B versus actual $5.3B (about 1.7% error) and an overall MAPE of 3.5%. This indicates SG&A investments are the primary revenue lever, implying higher ROI sensitivity to sales, marketing, and general administration spend relative to R&D. The FY revenue forecast is about $21B, down 0.1% year over year, signaling a flat to modestly softer near-term outlook.
Investment Thesis
The econometric model achieves strong accuracy (3.5% MAPE), suggesting Becton, Dickinson and Company's revenue trajectory is well-characterized by its spending patterns. R&D investment shows a 0.26x multiplier — each 1% increase in R&D spend is associated with a 0.26% revenue increase, signaling strong innovation-to-revenue conversion. Sales & marketing spend shows a 1.00x elasticity, suggesting effective go-to-market execution.
Revenue Forecast
Quarterly Detail
| Quarter | Model Forecast | Actual | 95% Range | YoY Growth | Status |
|---|---|---|---|---|---|
| Q3 2025 | $5.2B | $5.3B | $4.8B – $5.6B | +3.5% | ✓ In range |
| Q4 2025 | $5.2B | $4.7B – $5.9B | +1.1% | ||
| Q1 2026 | $5.3B | $4.6B – $6.1B | -0.0% | ||
| Q2 2026 | $5.3B | $4.5B – $6.3B | -3.4% | ||
| Q3 2026 | $5.4B | $4.5B – $6.4B | +2.3% |
Seasonal Factors
| Fiscal Quarter | Seasonal Factor | vs Trend | Interpretation | Obs. |
|---|---|---|---|---|
| FQ1 (Sep–Nov) | 1.0 | +0.0% | In line with trend | 0 |
| FQ2 (Dec–Feb) | 0.9734 | -2.7% | In line with trend | 15 |
| FQ3 (Mar–May) | 0.9945 | -0.6% | In line with trend | 15 |
| FQ4 (Jun–Aug) | 1.0143 | +1.4% | In line with trend | 15 |
How Spending Drives Revenue
Want this analysis for your portfolio?
I build custom revenue intelligence reports for investors and companies using SEC filing data, econometric modeling, and AI-powered insights.
Get in Touch