Baker Hughes Co BKR
Revenue Intelligence Report • 11 quarters of SEC filing data • Updated 2026-03-15
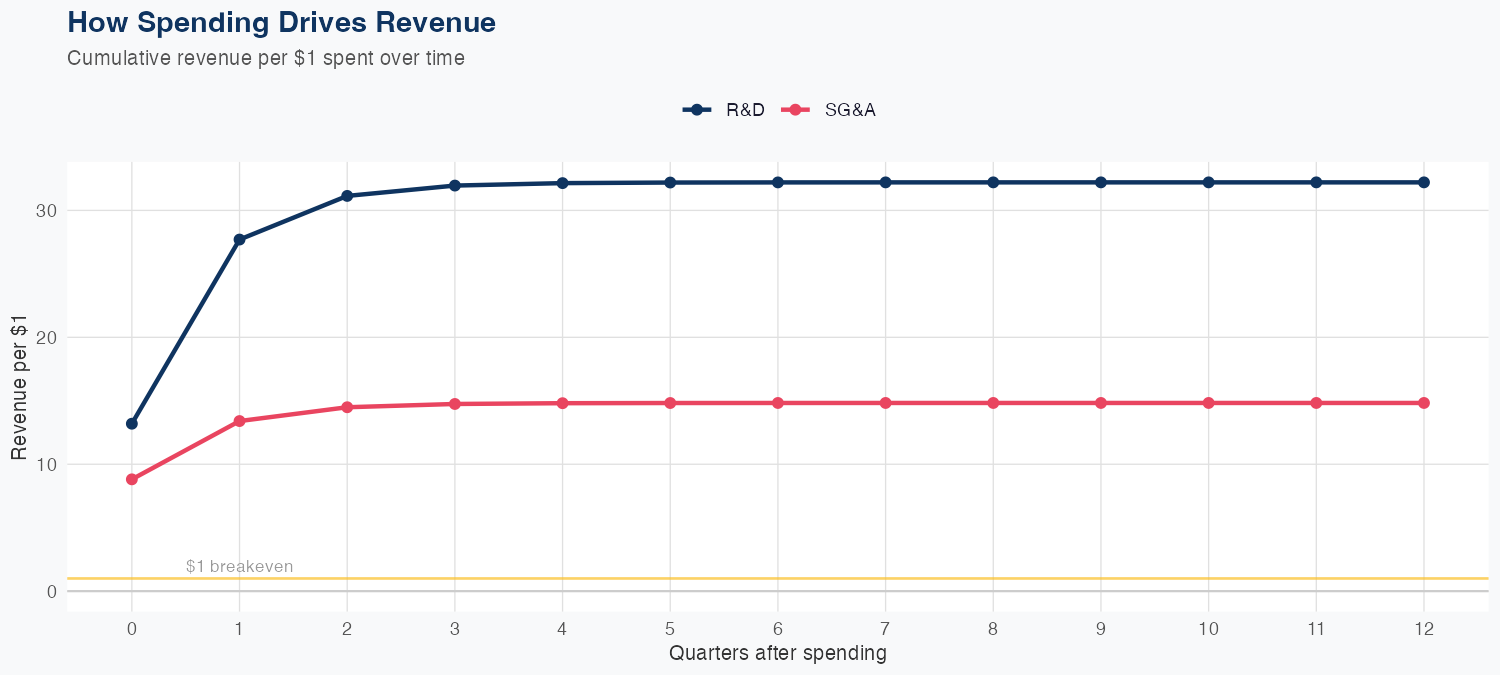
Baker Hughes Co has a forecasted full-year revenue of $26B, a -7.8% year-over-year change, based on 11 quarters of SEC filing data. Key revenue drivers include R&D ($32.10 per $1) and SG&A ($14.74 per $1). The ARDL model achieves strong accuracy at 2.7% MAPE.
Investment Thesis
Our ARDL model tracks Baker Hughes Co's revenue with exceptional precision (2.7% MAPE), indicating highly predictable cash flows. Every $1 of R&D investment is associated with $32.10 of revenue, indicating efficient capital deployment in innovation. Each $1 of SG&A spending generates $14.74 in revenue, reflecting strong commercial efficiency.
Revenue Forecast
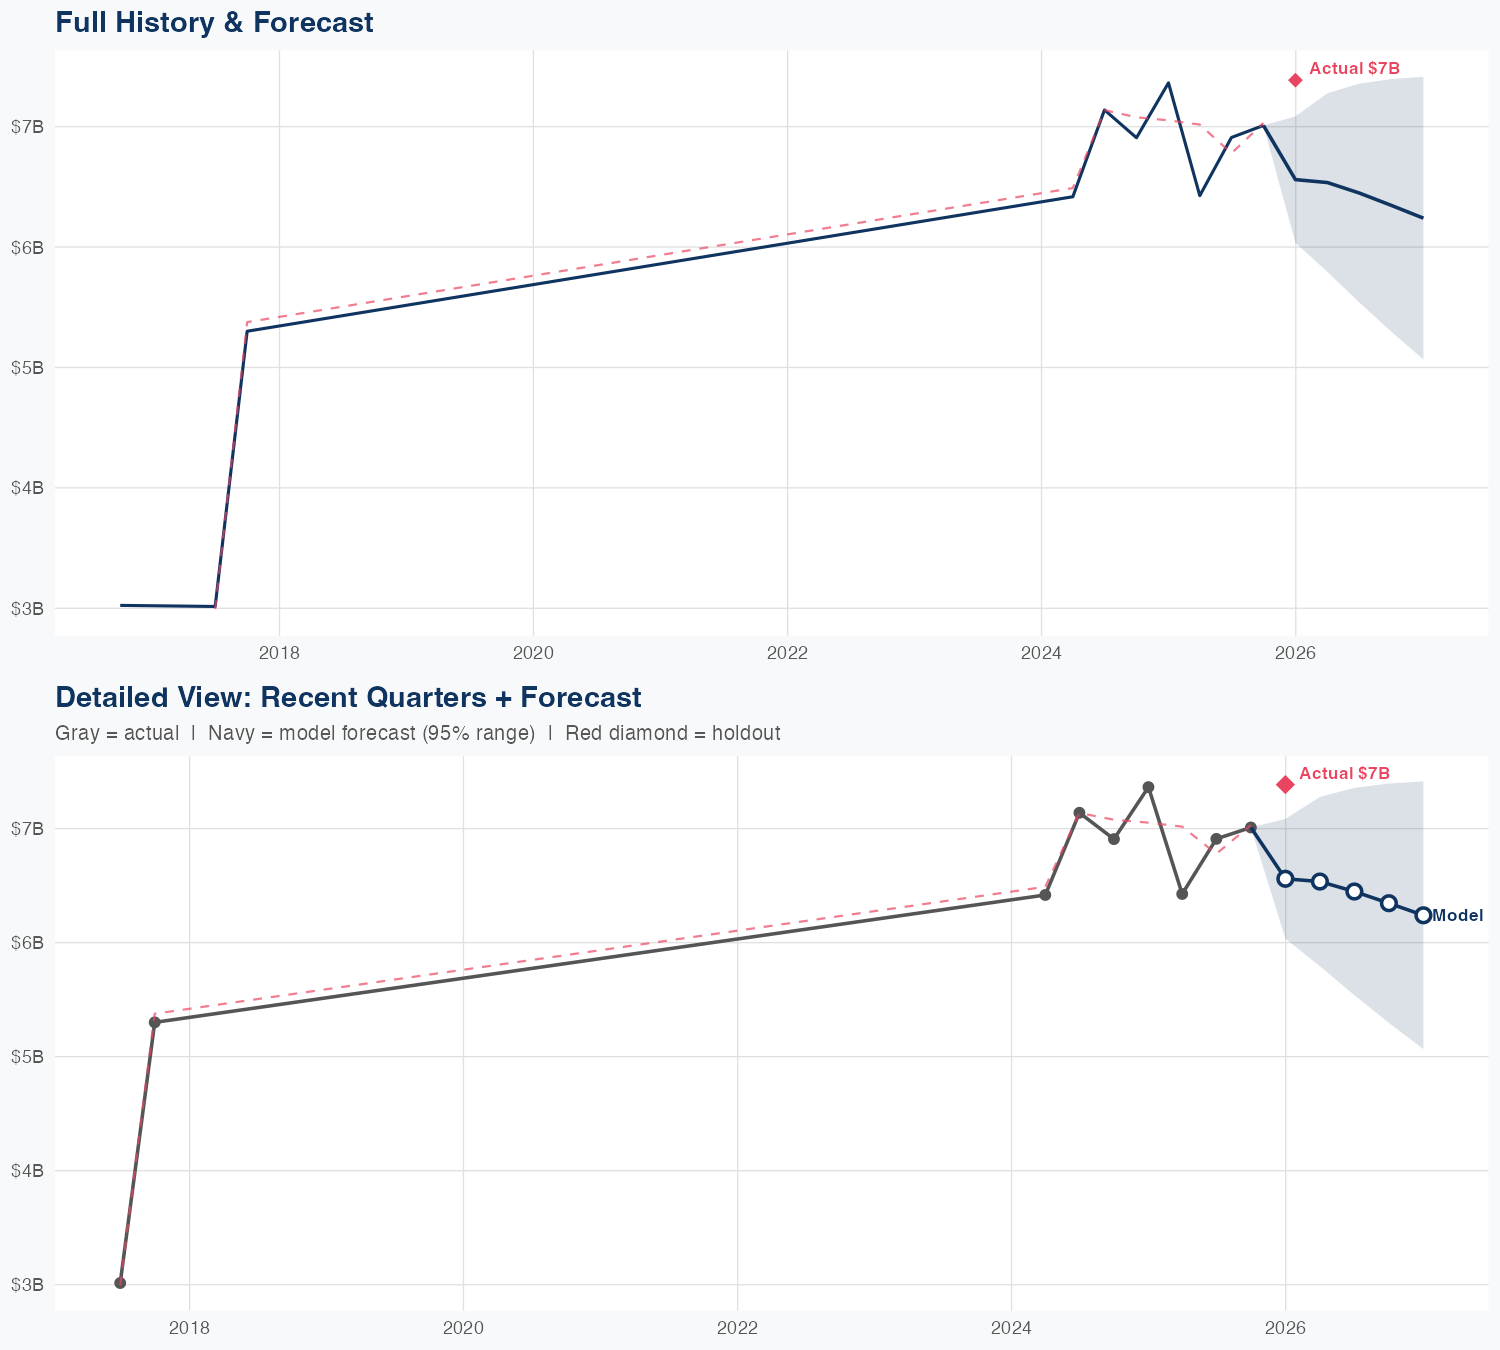
Quarterly Detail
| Quarter | Model Forecast | Actual | 95% Range | YoY Growth | Status |
|---|---|---|---|---|---|
| Q4 2025 | $6.6B | $7.4B | $6.0B – $7.1B | -11.0% | ✗ Outside range |
| Q2 2026 | $6.5B | $5.8B – $7.3B | +1.7% | ||
| Q3 2026 | $6.4B | $5.5B – $7.4B | -6.7% | ||
| Q4 2026 | $6.3B | $5.3B – $7.4B | -9.4% | ||
| Q1 2027 | $6.2B | $5.1B – $7.4B | -15.5% |
How Spending Drives Revenue
Want this analysis for your portfolio?
I build custom revenue intelligence reports for investors and companies using SEC filing data, econometric modeling, and AI-powered insights.
Get in Touch