Blackrock, Inc. BLK
Revenue Intelligence Report • 9 quarters of SEC filing data • Updated 2026-03-15
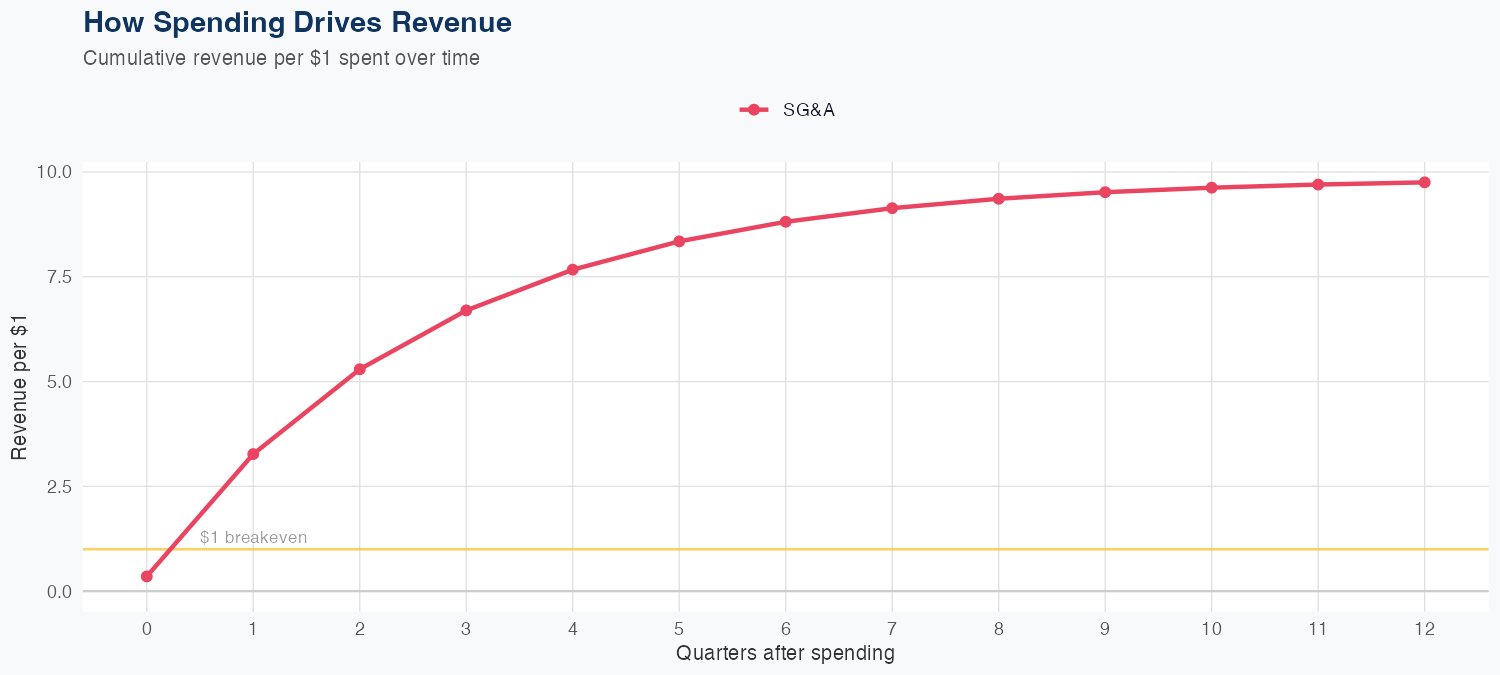
Revenue is driven by disciplined SG&A investments, with each $1 of SG&A spending expected to generate $9.75 in long-run revenue, while the latest quarterly revenue was $7.008 billion. A linear model applied over 9 quarters yields a 5.4% MAPE, indicating moderate but trackable accuracy. Holdout testing shows strong near-term reliability, with a forecast of $6.9 billion vs. actual $7.0 billion (1.1% error). The FY revenue forecast is $31 billion, up 29% year over year, highlighting a solid growth trajectory supported by efficient spending.
Investment Thesis
The econometric model achieves strong accuracy (5.4% MAPE), suggesting Blackrock, Inc.'s revenue trajectory is well-characterized by its spending patterns. Each $1 of SG&A spending generates $9.75 in revenue, reflecting strong commercial efficiency.
Revenue Forecast
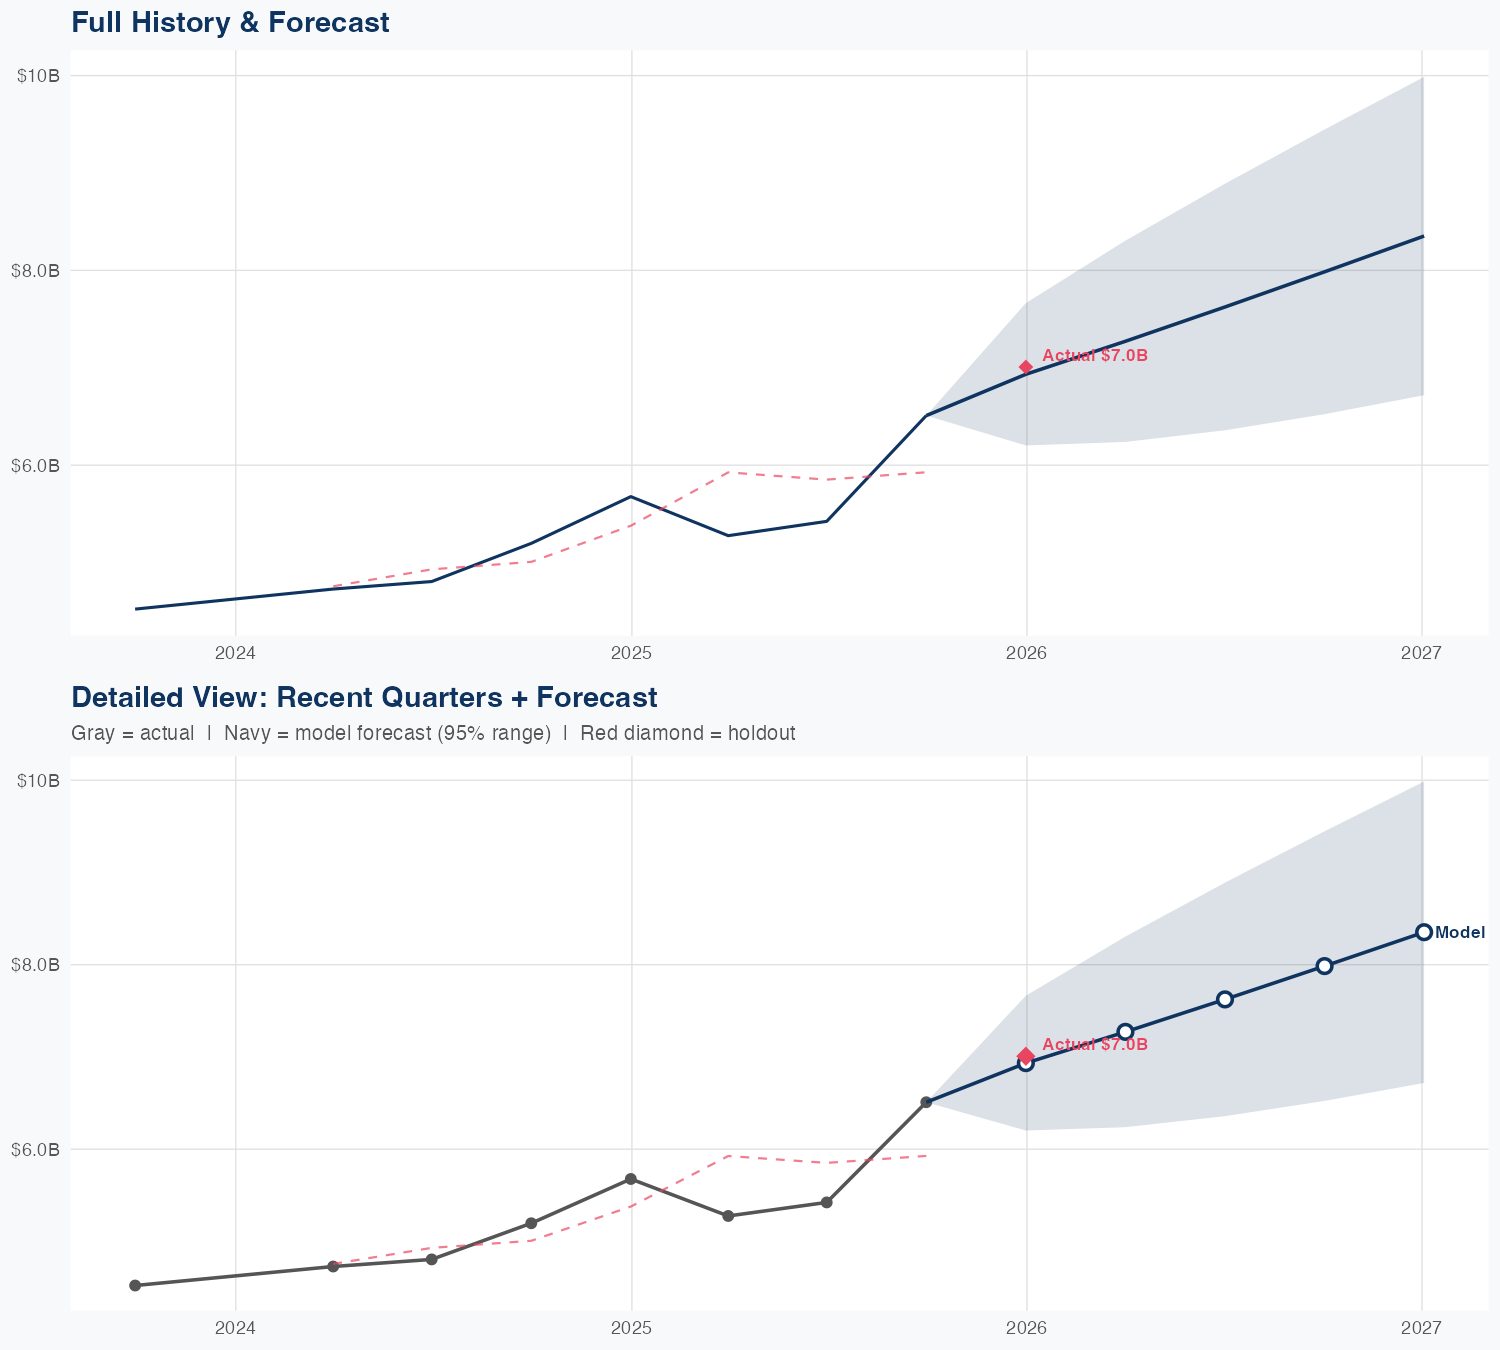
Quarterly Detail
| Quarter | Model Forecast | Actual | 95% Range | YoY Growth | Status |
|---|---|---|---|---|---|
| Q4 2025 | $6.9B | $7.0B | $6.2B – $7.7B | +22.1% | ✓ In range |
| Q2 2026 | $7.3B | $6.2B – $8.3B | +37.8% | ||
| Q3 2026 | $7.6B | $6.4B – $8.9B | +40.6% | ||
| Q4 2026 | $8.0B | $6.5B – $9.4B | +22.7% | ||
| Q1 2027 | $8.4B | $6.7B – $10.0B | +19.2% |
How Spending Drives Revenue
Want this analysis for your portfolio?
I build custom revenue intelligence reports for investors and companies using SEC filing data, econometric modeling, and AI-powered insights.
Get in Touch