Broadridge Financial Solutions, Inc. BR
Revenue Intelligence Report • 50 quarters of SEC filing data • Updated 2026-03-15
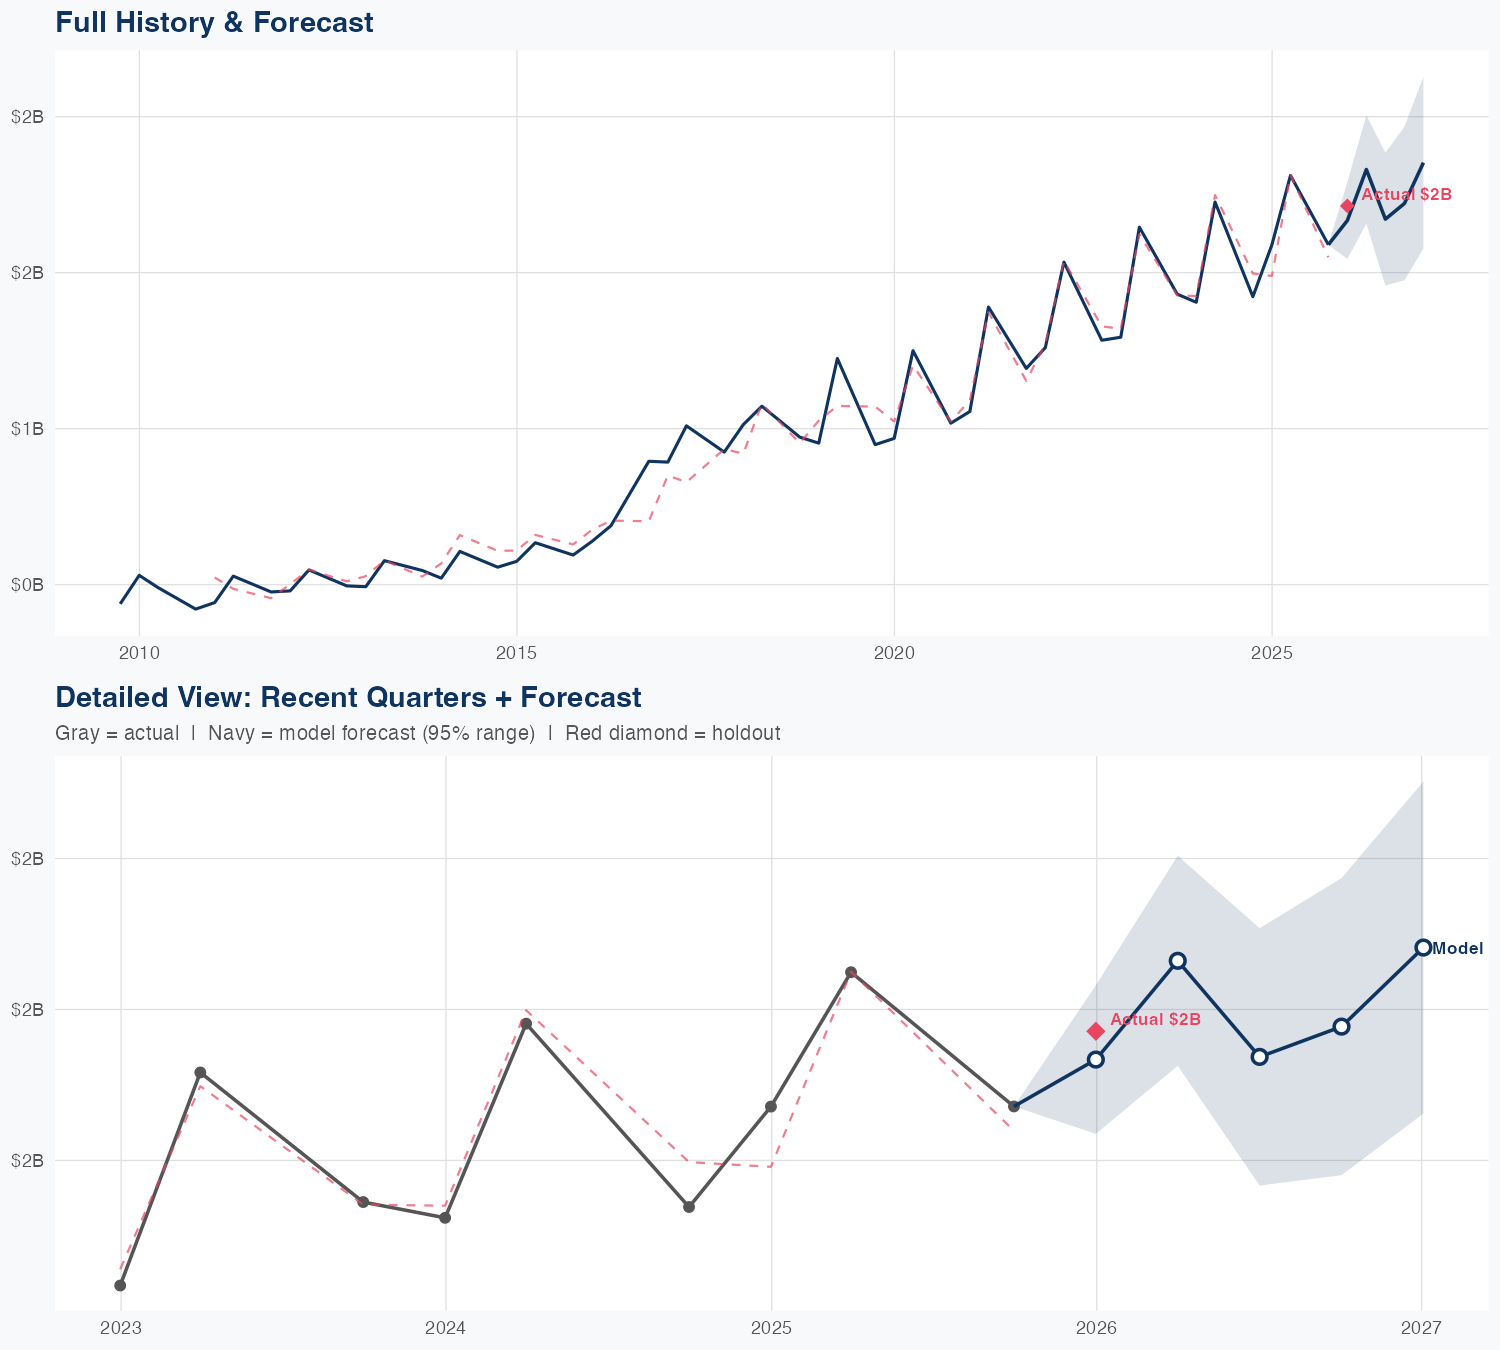
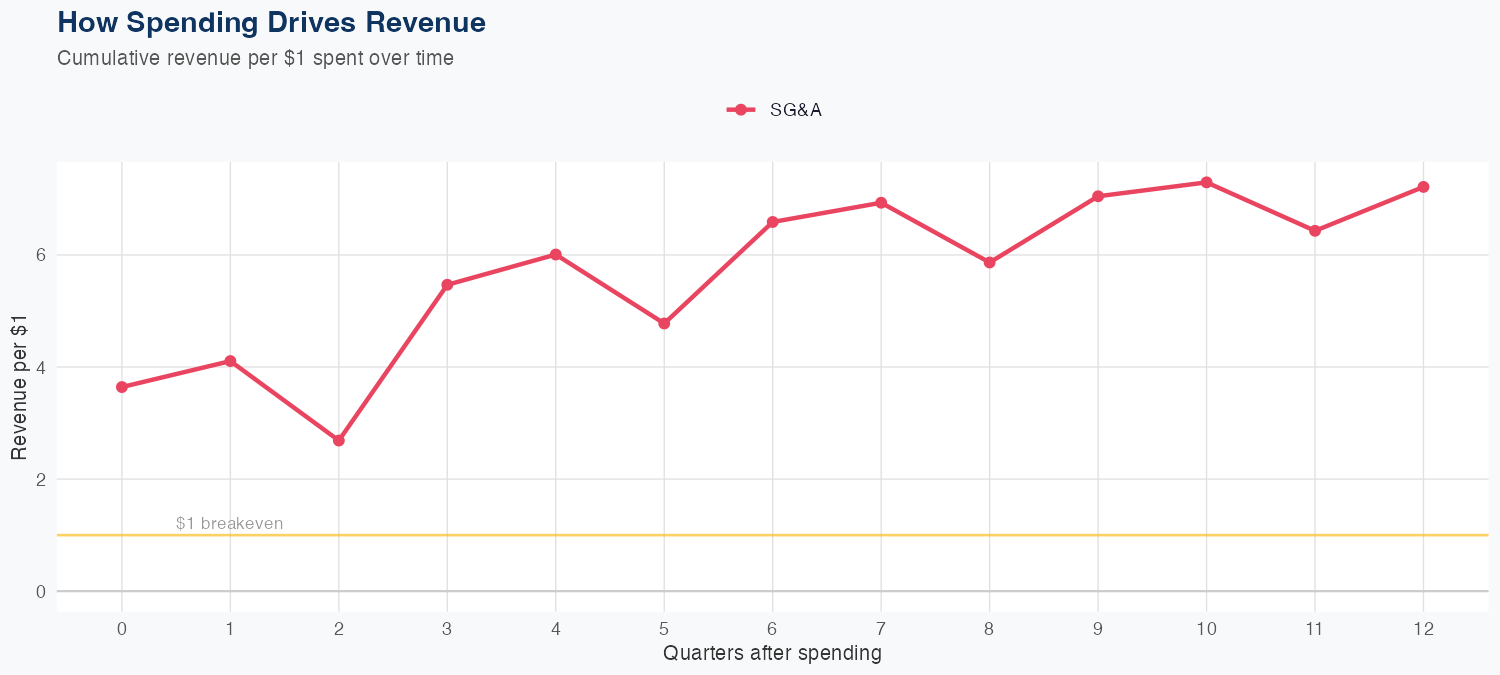
Revenue growth is primarily driven by a high SG&A-to-revenue efficiency, with the model estimating that every $1 of SG&A spending yields $7.21 of long-run revenue. Using a linear framework across 50 quarters, the model achieves 5.1% MAPE, with a holdout test predicting $1.7B for the latest quarter versus actual $1.7B (2.7% error). Latest quarterly revenue is $1.714B, and the full-year forecast is $7.1B, about 5.5% higher year over year. With SG&A-driven revenue as the key driver and no R&D input available, the outlook looks solid on topline growth, though investors should monitor the sustainability of this lever if macro conditions shift.
Investment Thesis
The econometric model achieves strong accuracy (5.1% MAPE), suggesting Broadridge Financial Solutions, Inc.'s revenue trajectory is well-characterized by its spending patterns. Each $1 of SG&A spending generates $7.21 in revenue, reflecting strong commercial efficiency.
Revenue Forecast
Quarterly Detail
| Quarter | Model Forecast | Actual | 95% Range | YoY Growth | Status |
|---|---|---|---|---|---|
| Q4 2025 | $1.7B | $1.7B | $1.5B – $1.8B | +17.2% | ✓ In range |
| Q2 2026 | $1.8B | $1.7B – $2.0B | +15.2% | ||
| Q3 2026 | $1.7B | $1.5B – $1.9B | -7.7% | ||
| Q4 2026 | $1.7B | $1.5B – $2.0B | +8.3% | ||
| Q1 2027 | $1.9B | $1.6B – $2.1B | +8.1% |
Seasonal Factors
| Fiscal Quarter | Seasonal Factor | vs Trend | Interpretation | Obs. |
|---|---|---|---|---|
| FQ1 (Sep–Nov) | 0.9947 | -0.5% | In line with trend | 15 |
| FQ2 (Dec–Feb) | 0.9624 | -3.8% | -3.8% below trend | 16 |
| FQ3 (Mar–May) | 0.9985 | -0.2% | In line with trend | 15 |
| FQ4 (Jun–Aug) | 1.0 | +0.0% | In line with trend | 0 |
How Spending Drives Revenue
Want this analysis for your portfolio?
I build custom revenue intelligence reports for investors and companies using SEC filing data, econometric modeling, and AI-powered insights.
Get in Touch