The Cigna Group CI
Revenue Intelligence Report • 32 quarters of SEC filing data • Updated 2026-03-15
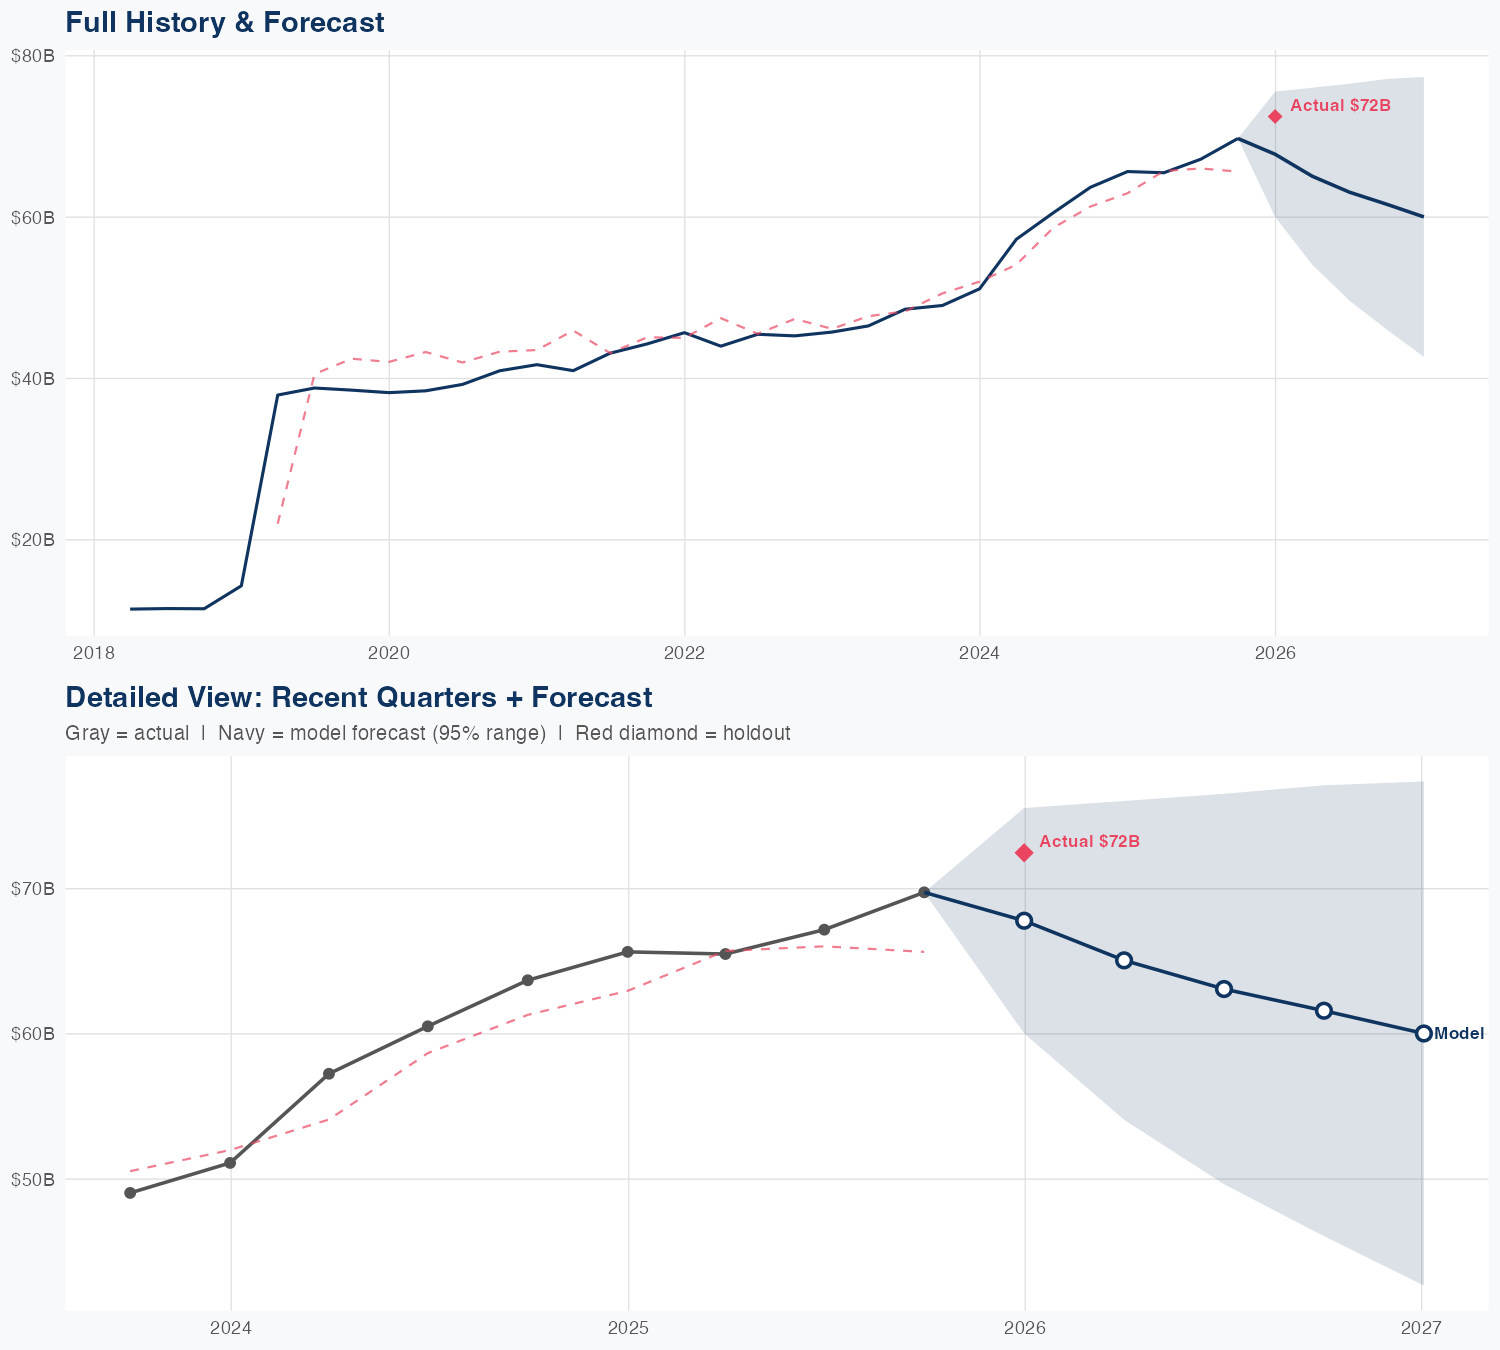
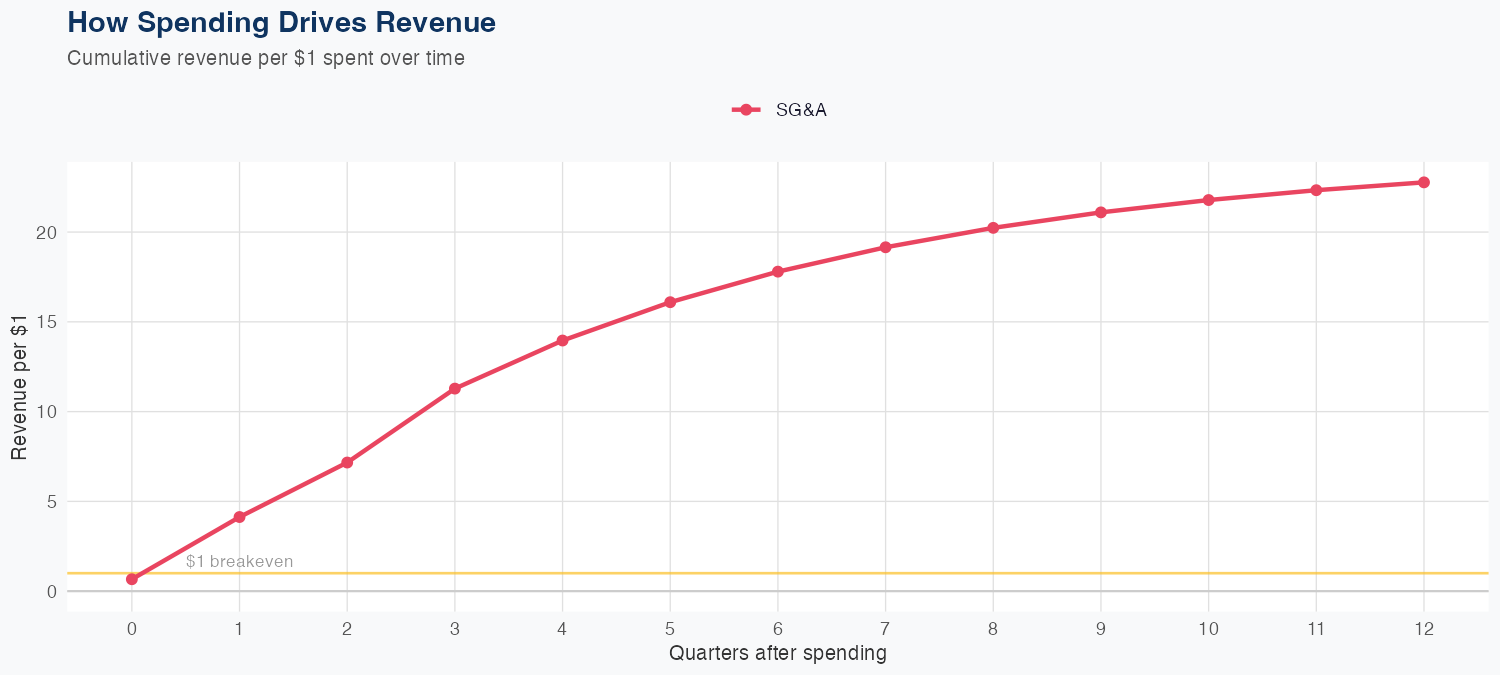
Our econometric model shows the 9.1% YoY revenue drop is being offset more by SG&A efficiency than by member growth or pricing power—SG&A ROI of 22.77x implies growth is coming from how effectively overhead and marketing are monetized, not just volume. The holdout miss (predicted 67.8B vs actual 72.5B, -6.5%) signals forecast sensitivity and out-of-sample risk, even as overall MAPE sits at 5.8%. Near-term upside hinges on sustaining SG&A-driven lift and favorable mix rather than a new product cycle. In a competitive, highly regulated market, the path to margin resilience depends on enrollment stability, pricing discipline, and ongoing efficiency gains.
Investment Thesis
The econometric model achieves strong accuracy (5.8% MAPE), suggesting The Cigna Group's revenue trajectory is well-characterized by its spending patterns. Each $1 of SG&A spending generates $22.77 in revenue, reflecting strong commercial efficiency.
Revenue Forecast
Quarterly Detail
| Quarter | Model Forecast | Actual | 95% Range | YoY Growth | Status |
|---|---|---|---|---|---|
| Q4 2025 | $68B | $72B | $60B – $76B | +3.3% | ✓ In range |
| Q2 2026 | $65B | $54B – $76B | -0.7% | ||
| Q3 2026 | $63B | $50B – $77B | -6.1% | ||
| Q4 2026 | $62B | $46B – $77B | -11.7% | ||
| Q1 2027 | $60B | $43B – $77B | -17.2% |
Seasonal Factors
| Fiscal Quarter | Seasonal Factor | vs Trend | Interpretation | Obs. |
|---|---|---|---|---|
| FQ1 (Sep–Nov) | 0.9703 | -3.0% | In line with trend | 7 |
| FQ2 (Dec–Feb) | 0.9913 | -0.9% | In line with trend | 7 |
| FQ3 (Mar–May) | 0.9749 | -2.5% | In line with trend | 7 |
| FQ4 (Jun–Aug) | 0.9996 | -0.0% | In line with trend | 7 |
How Spending Drives Revenue
Want this analysis for your portfolio?
I build custom revenue intelligence reports for investors and companies using SEC filing data, econometric modeling, and AI-powered insights.
Get in Touch