Walt Disney Co DIS
Revenue Intelligence Report • 25 quarters of SEC filing data • Updated 2026-03-15
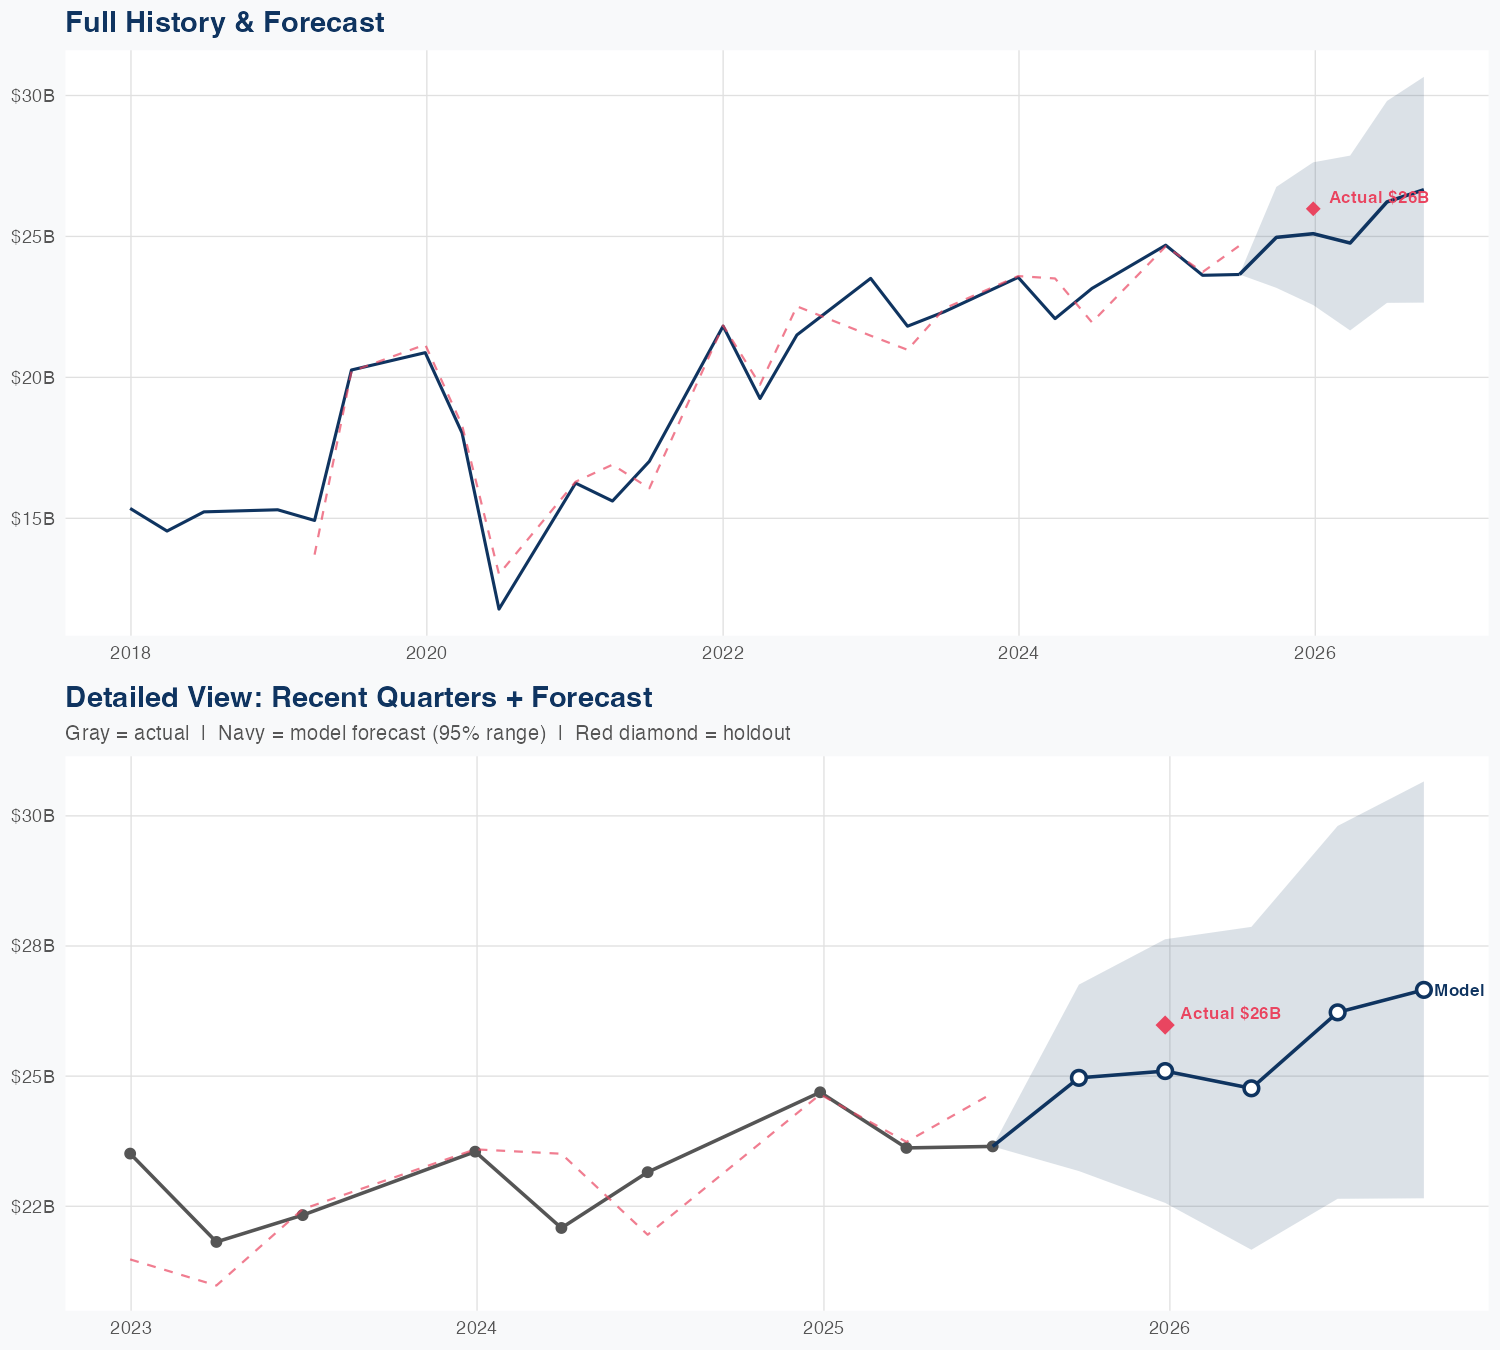
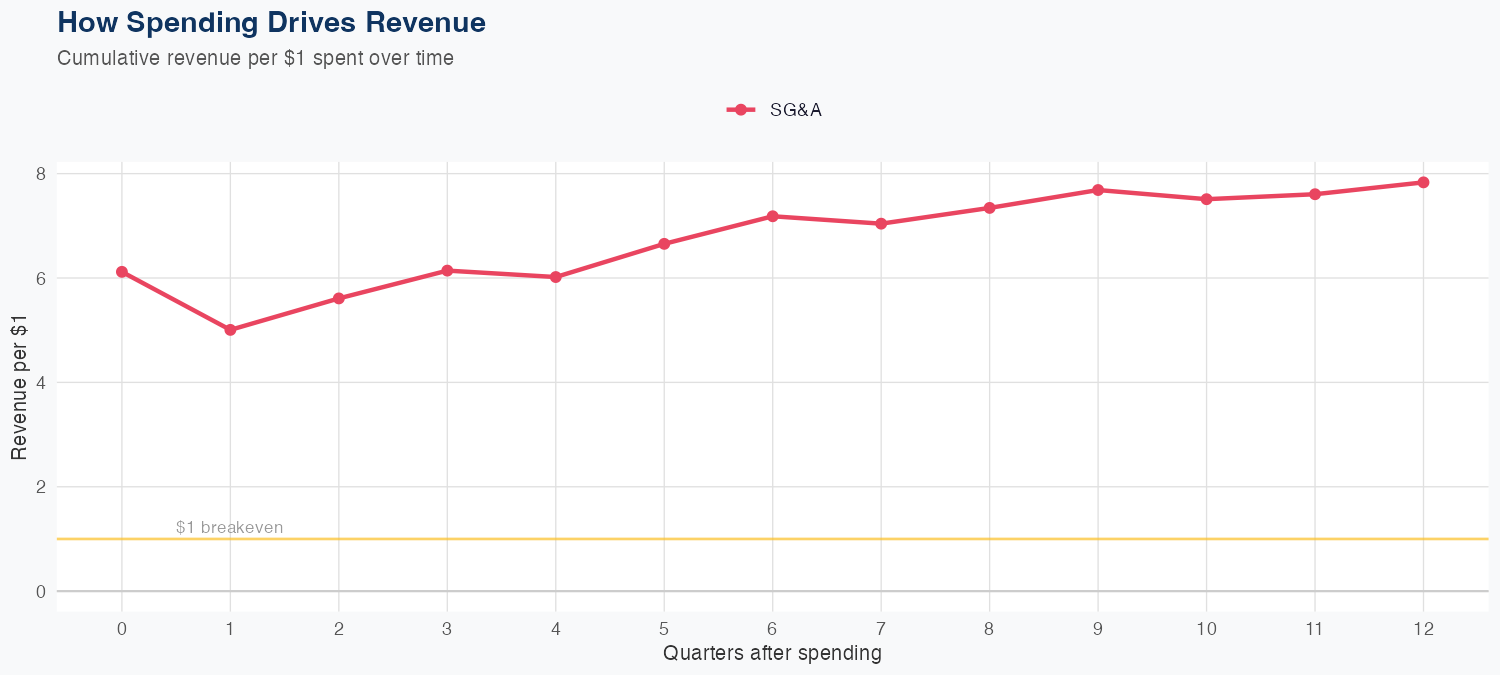
Disney's revenue appears highly levered to SG&A spend, per our econometric model, which shows an SG&A ROI of $7.83 per $1 and implies incremental selling and promotional spend yields outsized revenue lift. That elasticity suggests near-term growth hinges on marketing and distribution intensity—especially in Direct-to-Consumer and Parks—rather than cost cuts; a deteriorating ROI on SG&A would slow revenue growth even with the same spend. Holdout error of -3.9% (actual 26.0 vs predicted 25.0) indicates the model underpredicts in stronger periods, but a 3.7% MAPE across 25 quarters signals solid forecast reliability. The 4.9% YoY growth exposes Disney to margin and execution risk if content costs rise, streaming competition accelerates, or park demand softens, making growth highly sensitive to franchise performance and macro travel trends.
Investment Thesis
The econometric model achieves strong accuracy (3.7% MAPE), suggesting Walt Disney Co's revenue trajectory is well-characterized by its spending patterns. Each $1 of SG&A spending generates $7.83 in revenue, reflecting strong commercial efficiency.
Revenue Forecast
Quarterly Detail
| Quarter | Model Forecast | Actual | 95% Range | YoY Growth | Status |
|---|---|---|---|---|---|
| Q3 2025 | $25B | $26B | $23B – $27B | +7.8% | ✓ In range |
| Q4 2025 | $25B | $23B – $28B | +1.6% | ||
| Q1 2026 | $25B | $22B – $28B | +4.8% | ||
| Q2 2026 | $26B | $23B – $30B | +10.9% | ||
| Q3 2026 | $27B | $23B – $31B | +2.6% |
Seasonal Factors
| Fiscal Quarter | Seasonal Factor | vs Trend | Interpretation | Obs. |
|---|---|---|---|---|
| FQ1 (Sep–Nov) | 1.0 | +0.0% | In line with trend | 0 |
| FQ2 (Dec–Feb) | 0.999 | -0.1% | In line with trend | 7 |
| FQ3 (Mar–May) | 0.9851 | -1.5% | In line with trend | 7 |
| FQ4 (Jun–Aug) | 0.9949 | -0.5% | In line with trend | 7 |
How Spending Drives Revenue
Want this analysis for your portfolio?
I build custom revenue intelligence reports for investors and companies using SEC filing data, econometric modeling, and AI-powered insights.
Get in Touch