Equifax inc. EFX
Revenue Intelligence Report • 36 quarters of SEC filing data • Updated 2026-03-15
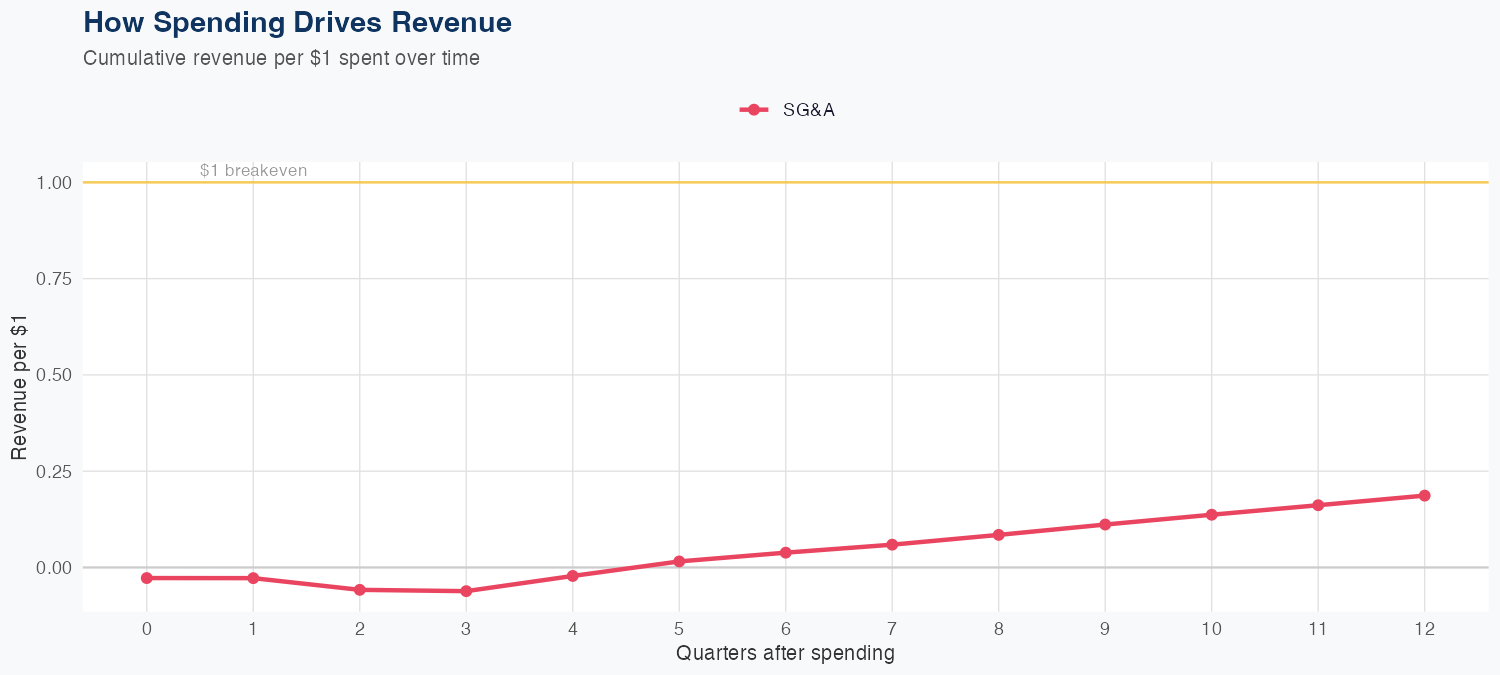
Revenue is driven by SG&A spending efficiency, with each $1 of SG&A generating about $0.19 of long-run revenue, while R&D data is not available for assessment. The model is linear and achieves a 2.4% MAPE, with a holdout test predicting $1.5B versus $1.6B actual (0.7% error) across 36 quarters of history. The FY forecast calls for $6.4B in revenue, up about 5.5% year over year, signaling a steady growth trajectory. For investors, the takeaway is that SG&A efficiency is the main lever on revenue, supported by a reliable forecast framework and a modest but constructive outlook.
Investment Thesis
Our ARDL model tracks Equifax inc.'s revenue with exceptional precision (2.4% MAPE), indicating highly predictable cash flows. Each $1 of SG&A spending generates $0.19 in revenue, reflecting strong commercial efficiency.
Revenue Forecast
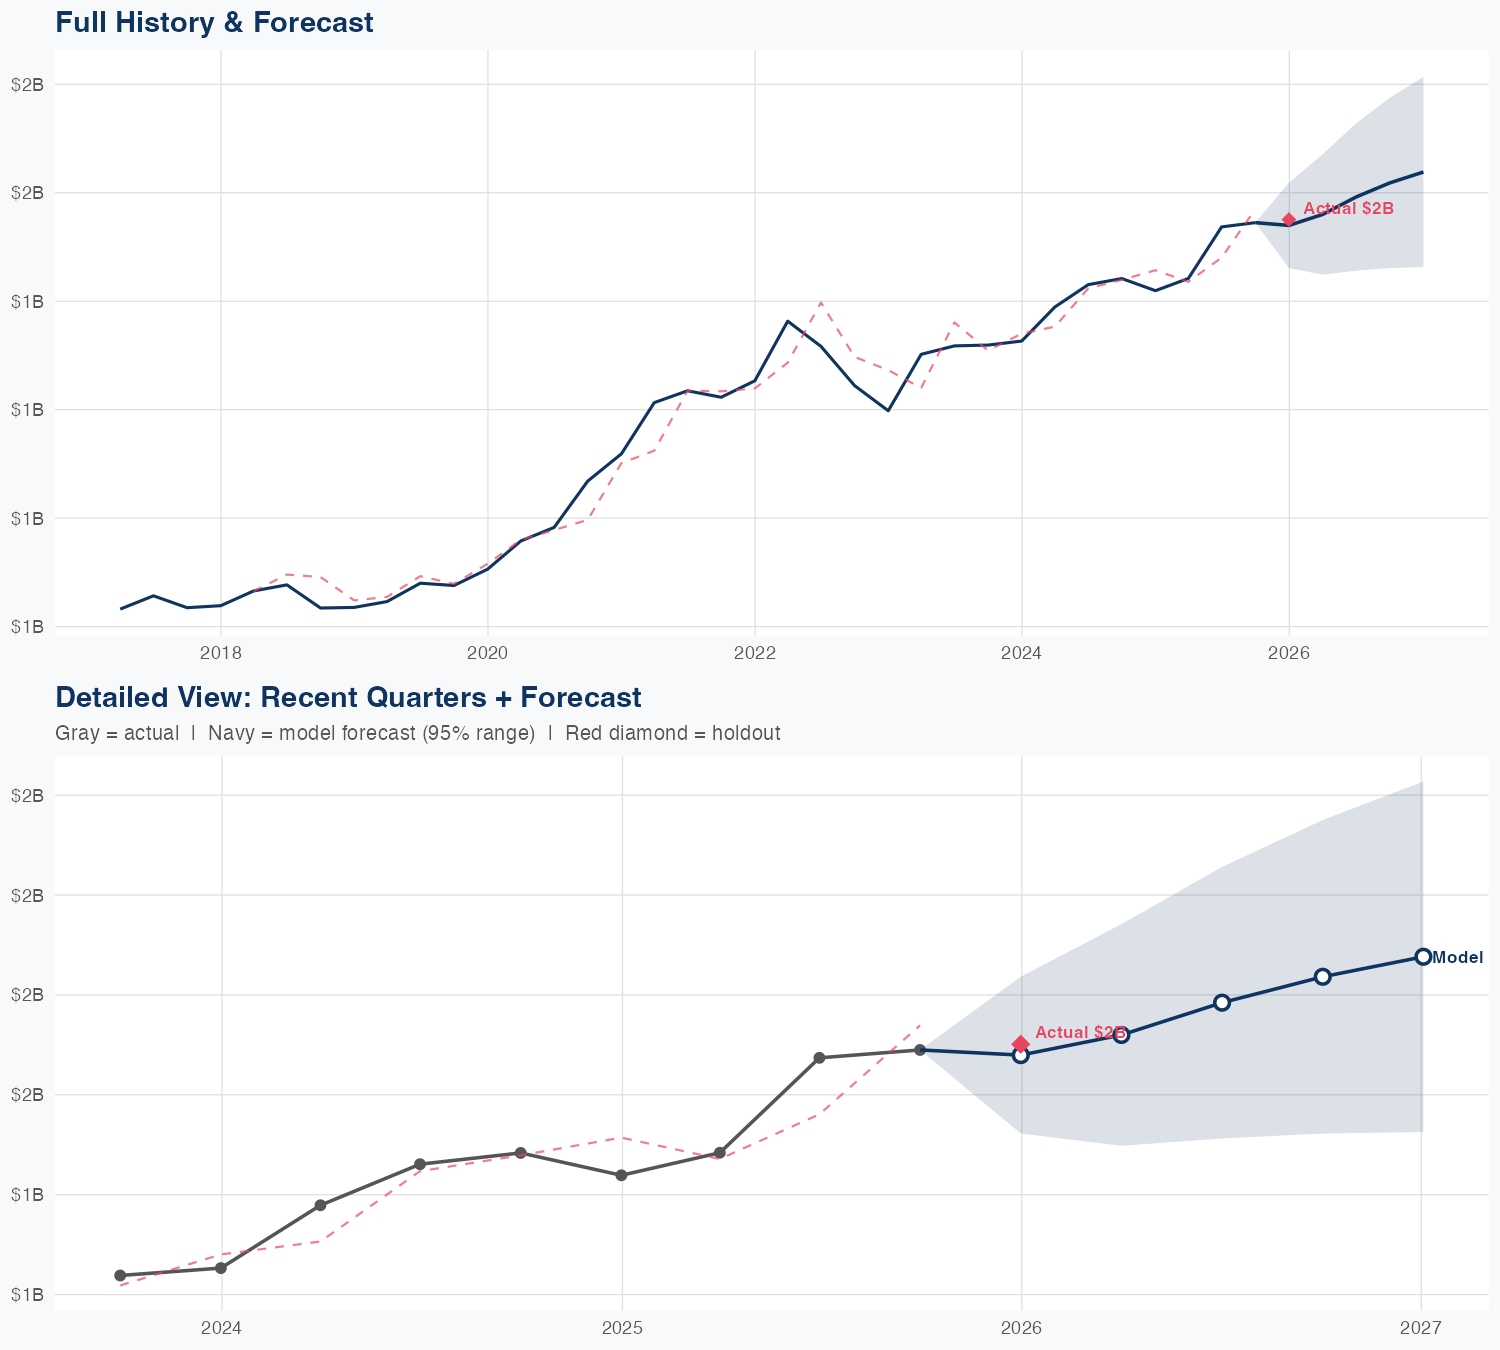
Quarterly Detail
| Quarter | Model Forecast | Actual | 95% Range | YoY Growth | Status |
|---|---|---|---|---|---|
| Q4 2025 | $1.5B | $1.6B | $1.5B – $1.6B | +8.5% | ✓ In range |
| Q2 2026 | $1.6B | $1.4B – $1.7B | +8.2% | ||
| Q3 2026 | $1.6B | $1.5B – $1.7B | +3.6% | ||
| Q4 2026 | $1.6B | $1.5B – $1.8B | +4.7% | ||
| Q1 2027 | $1.6B | $1.5B – $1.8B | +5.7% |
Seasonal Factors
| Fiscal Quarter | Seasonal Factor | vs Trend | Interpretation | Obs. |
|---|---|---|---|---|
| FQ1 (Sep–Nov) | 0.9965 | -0.4% | In line with trend | 8 |
| FQ2 (Dec–Feb) | 0.9898 | -1.0% | In line with trend | 8 |
| FQ3 (Mar–May) | 1.0268 | +2.7% | In line with trend | 8 |
| FQ4 (Jun–Aug) | 0.9998 | -0.0% | In line with trend | 8 |
How Spending Drives Revenue
Want this analysis for your portfolio?
I build custom revenue intelligence reports for investors and companies using SEC filing data, econometric modeling, and AI-powered insights.
Get in Touch