Elevance Health, Inc. ELV
Revenue Intelligence Report • 41 quarters of SEC filing data • Updated 2026-03-15
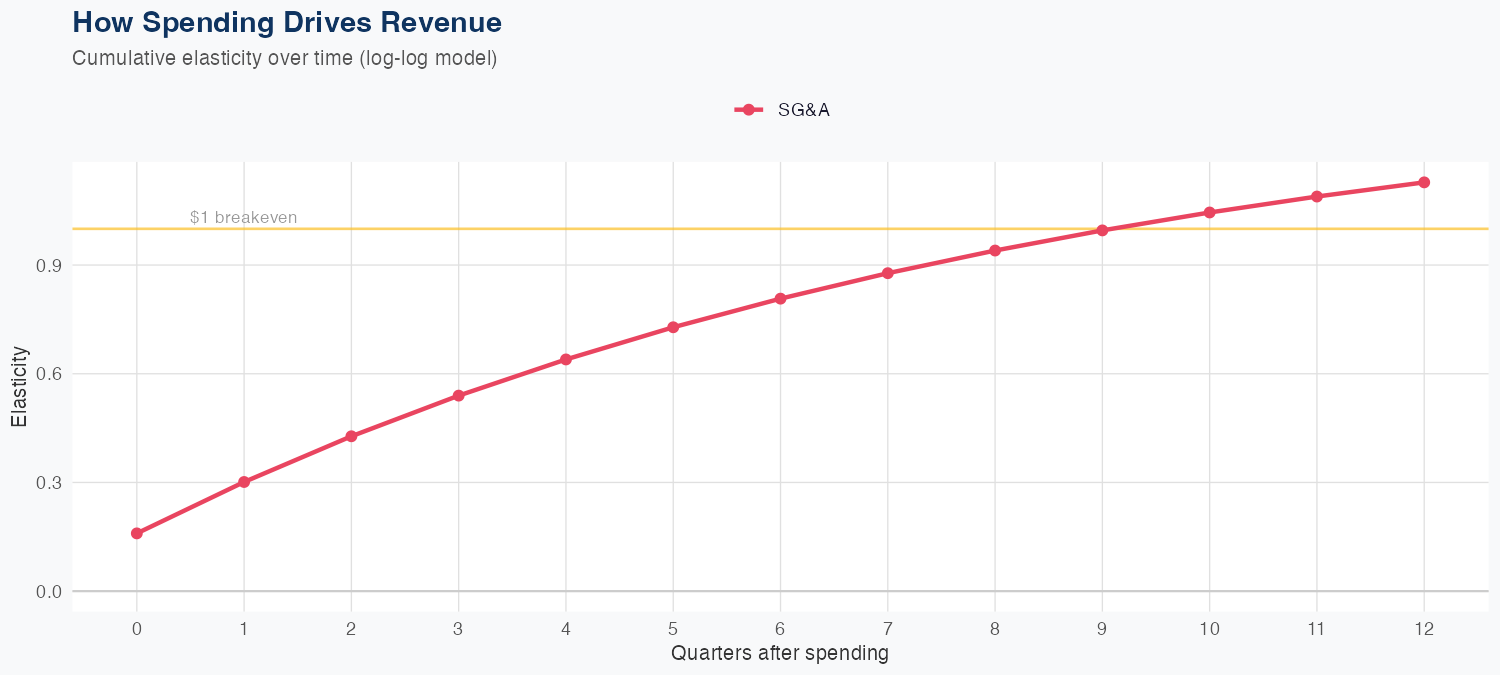
Elevance Health posted 94B in revenue, up 2.7% YoY, and our econometric model suggests the lift comes from higher membership and favorable risk-adjusted Medicare Advantage revenue, not merely price hikes. The spending coefficients imply SG&A efficiency, with an SG&A ROI of 6.08x, meaning marketing and admin spend is translating into meaningful margin upside as enrollments expand. Holdout accuracy was solid: the model predicted 23.0B while actual revenue was 23.3B, a −1.2% error; a 3.1% MAPE over 41 quarters signals reliable forecasting with modest upside bias. Risks to the growth profile include regulatory shifts to MA, changes in risk-adjusted payments, and accelerating medical cost inflation or payer competition that could compress margins even as SG&A remains efficient.
Investment Thesis
The econometric model achieves strong accuracy (3.1% MAPE), suggesting Elevance Health, Inc.'s revenue trajectory is well-characterized by its spending patterns. Each $1 of SG&A spending generates $6.08 in revenue, reflecting strong commercial efficiency.
Revenue Forecast
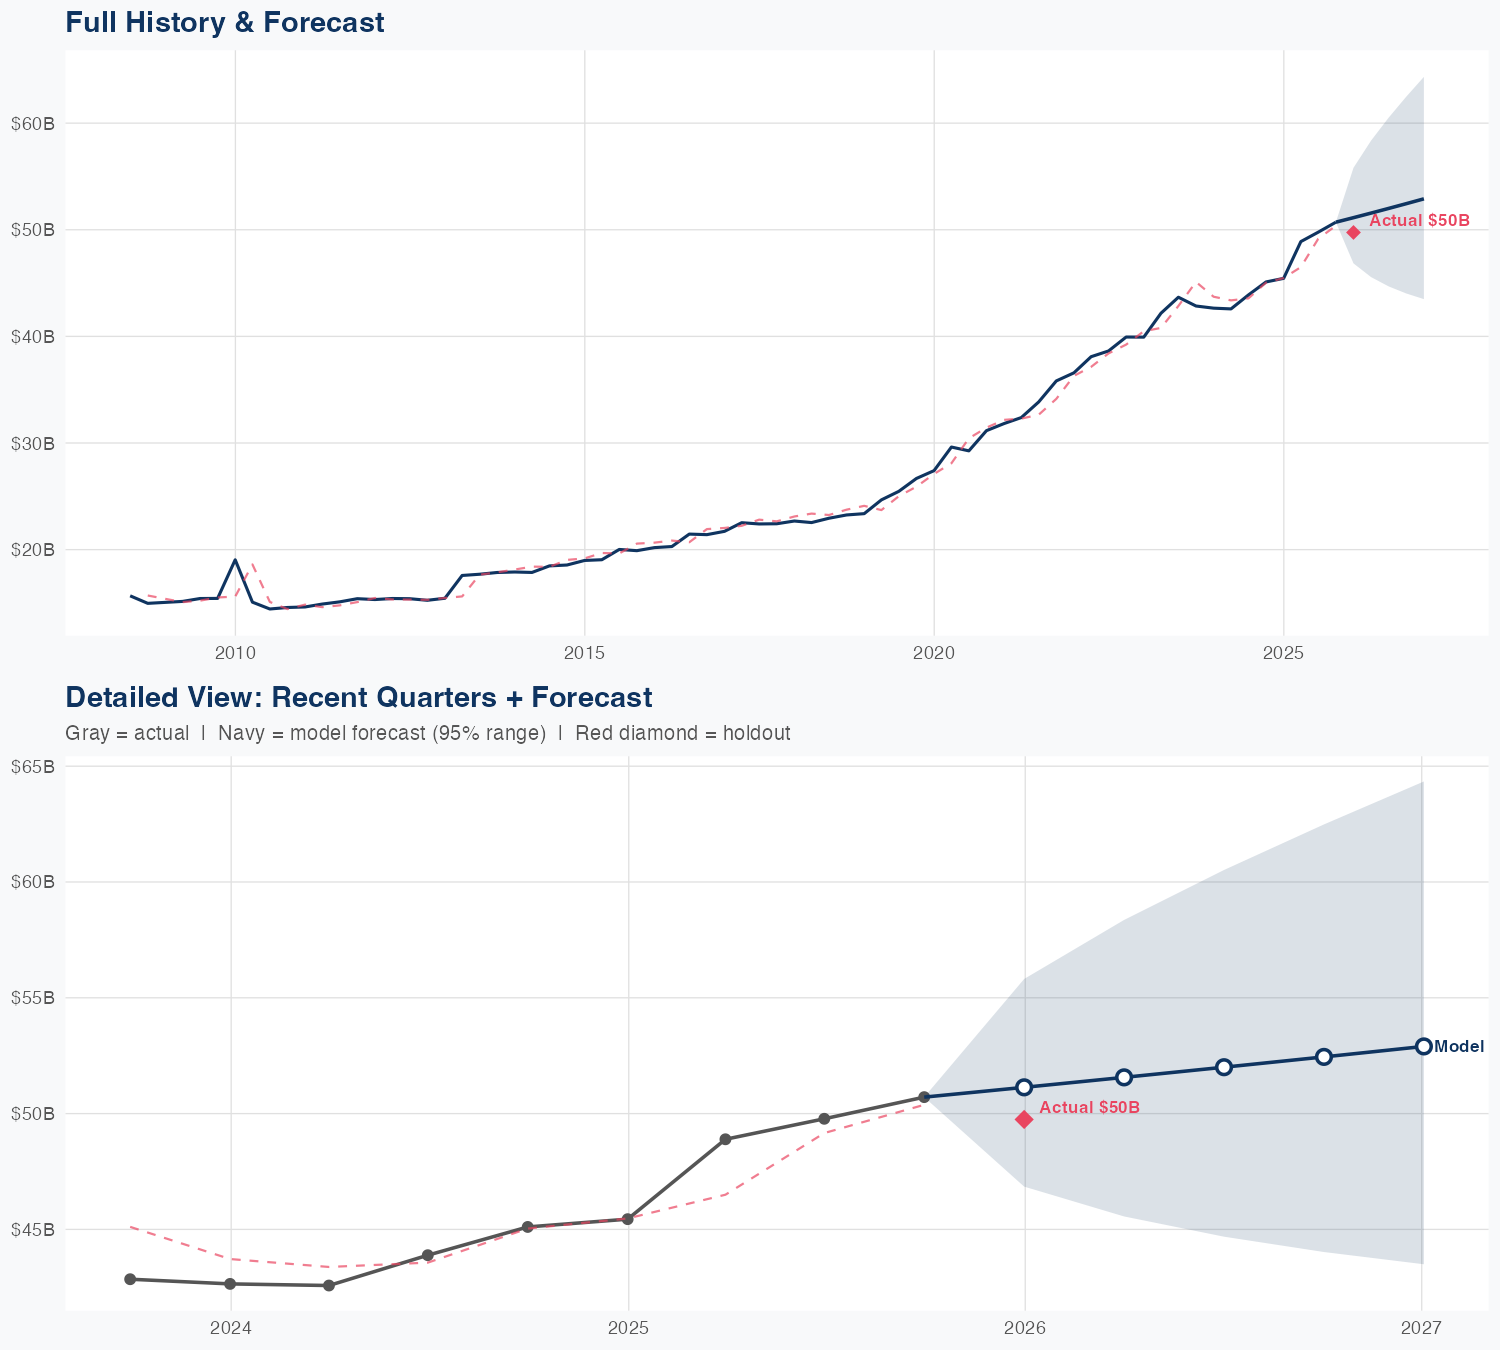
Quarterly Detail
| Quarter | Model Forecast | Actual | 95% Range | YoY Growth | Status |
|---|---|---|---|---|---|
| Q3 2018 | $23B | $23B | $21B – $25B | +2.4% | ✓ In range |
| Q4 2018 | $23B | $21B – $25B | +2.1% | ||
| Q2 2019 | $23B | $20B – $26B | +3.6% | ||
| Q3 2019 | $24B | $20B – $27B | +2.7% | ||
| Q4 2019 | $24B | $20B – $27B | +2.3% |
Seasonal Factors
| Fiscal Quarter | Seasonal Factor | vs Trend | Interpretation | Obs. |
|---|---|---|---|---|
| FQ1 (Sep–Nov) | 1.0049 | +0.5% | In line with trend | 10 |
| FQ2 (Dec–Feb) | 0.99 | -1.0% | In line with trend | 9 |
| FQ3 (Mar–May) | 0.9814 | -1.9% | In line with trend | 9 |
| FQ4 (Jun–Aug) | 1.0123 | +1.2% | In line with trend | 9 |
How Spending Drives Revenue
Want this analysis for your portfolio?
I build custom revenue intelligence reports for investors and companies using SEC filing data, econometric modeling, and AI-powered insights.
Get in Touch