Ford Motor Co F
Revenue Intelligence Report • 70 quarters of SEC filing data • Updated 2026-03-15
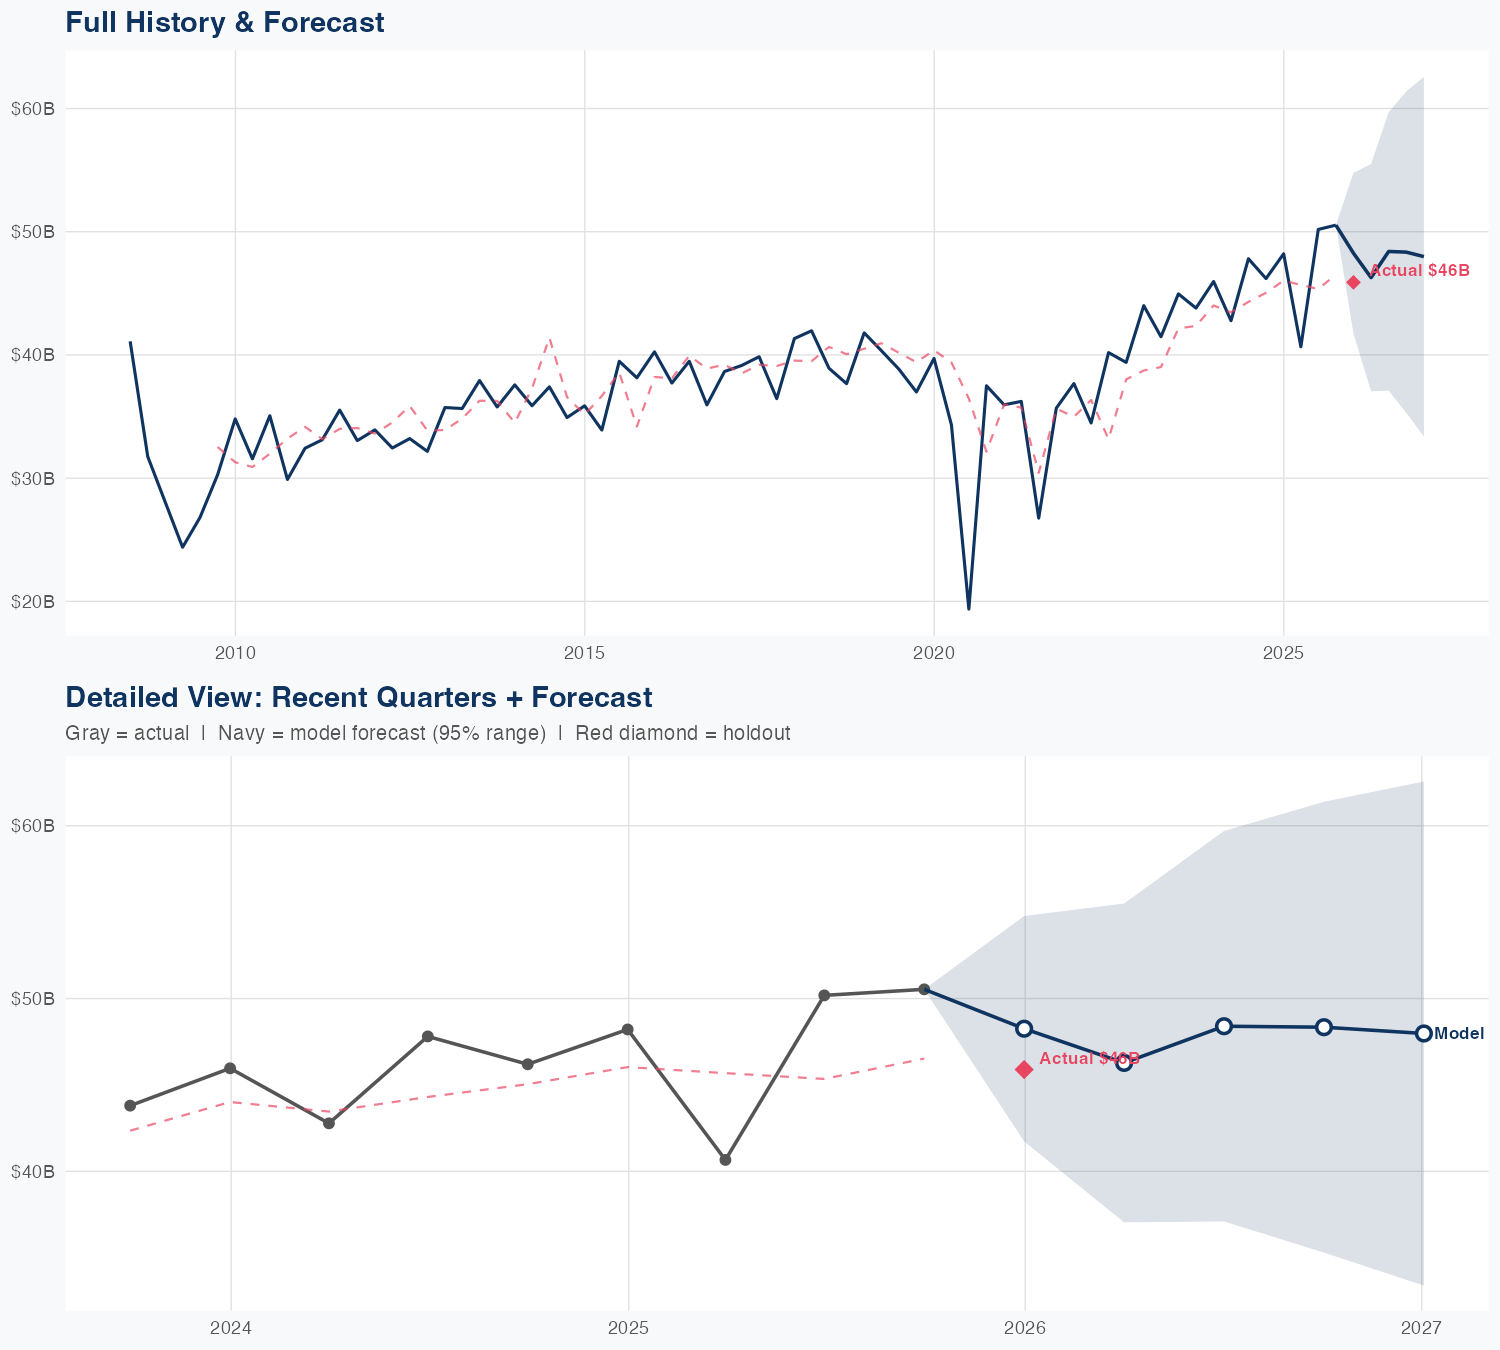
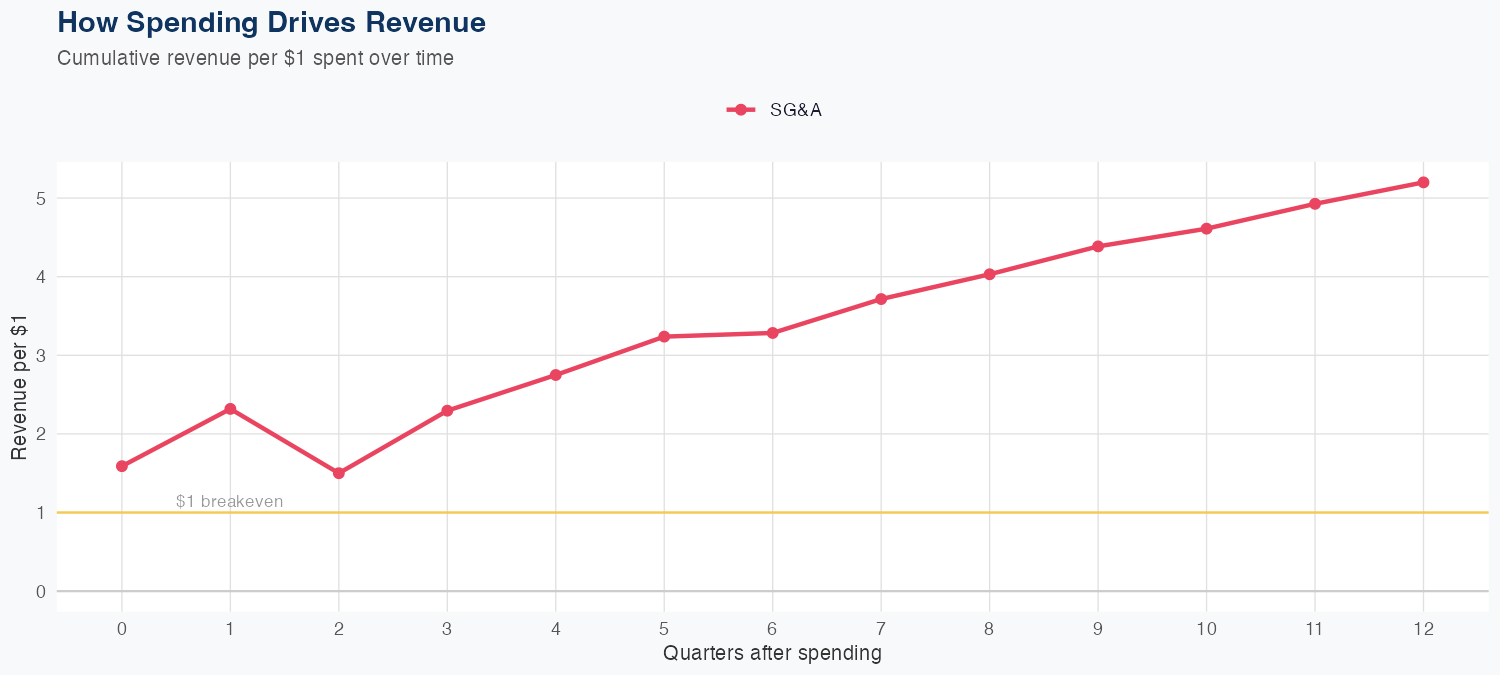
Ford’s top-line growth remains modest and appears to hinge on efficient SG&A spend rather than a material ramp in volumes, as shown by our econometric model: SG&A ROI of 5.20x and a long-run linear relationship estimated over 70 quarters with a 6.8% MAPE. In practice, incremental revenue seems driven by marketing and operating leverage, not new product cycles, suggesting the growth engine could be brittle if demand slows. The holdout forecast overpredicted by about 5% (48.3B predicted vs 45.9B actual), signaling only modest forecast bias but a need for a conservative planning cushion. At about 2% growth, Ford’s risk profile includes macro demand shifts, pricing/mix, and the EV transition, with upside contingent on demand stability and margin leverage, while downside risk ties to input costs, supply constraints, and potential SG&A intensity in a softer volume environment.
Investment Thesis
The econometric model achieves strong accuracy (6.8% MAPE), suggesting Ford Motor Co's revenue trajectory is well-characterized by its spending patterns. Each $1 of SG&A spending generates $5.20 in revenue, reflecting strong commercial efficiency.
Revenue Forecast
Quarterly Detail
| Quarter | Model Forecast | Actual | 95% Range | YoY Growth | Status |
|---|---|---|---|---|---|
| Q4 2025 | $48B | $46B | $42B – $55B | +0.1% | ✓ In range |
| Q2 2026 | $46B | $37B – $56B | +13.8% | ||
| Q3 2026 | $48B | $37B – $60B | -3.6% | ||
| Q4 2026 | $48B | $35B – $61B | -4.3% | ||
| Q1 2027 | $48B | $33B – $63B | +4.5% |
Seasonal Factors
| Fiscal Quarter | Seasonal Factor | vs Trend | Interpretation | Obs. |
|---|---|---|---|---|
| FQ1 (Sep–Nov) | 0.97 | -3.0% | -3.0% below trend | 17 |
| FQ2 (Dec–Feb) | 1.0443 | +4.4% | +4.4% above trend | 17 |
| FQ3 (Mar–May) | 0.9899 | -1.0% | In line with trend | 16 |
| FQ4 (Jun–Aug) | 1.0235 | +2.4% | In line with trend | 16 |
How Spending Drives Revenue
Want this analysis for your portfolio?
I build custom revenue intelligence reports for investors and companies using SEC filing data, econometric modeling, and AI-powered insights.
Get in Touch