Fox Corporation FOX
Revenue Intelligence Report • 25 quarters of SEC filing data • Updated 2026-03-15
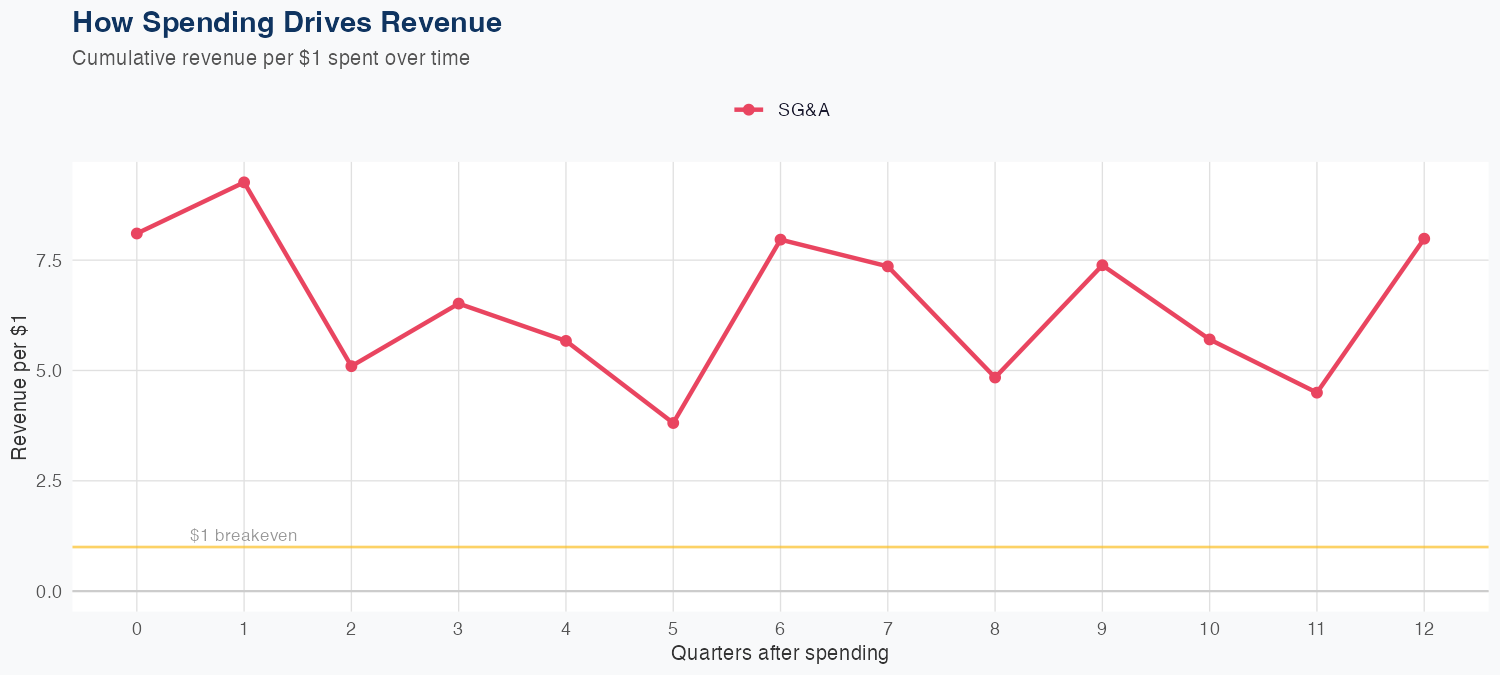
Revenue is primarily driven by SG&A efficiency, with every $1 of SG&A spending generating approximately $7.99 in long-run revenue, indicating a strong ROI on selling, general, and administrative activities. Using a linear model across 25 quarters, the forecast shows a MAPE of 5.4%; in out-of-sample testing, a $4.7B forecast missed the $5.2B actual by 9.7%. Latest quarterly revenue stands at $5.182B. FY revenue is forecast at $18B, down 3.5% year over year, signaling a modest top-line decline and continued reliance on SG&A-driven revenue.
Investment Thesis
The econometric model achieves strong accuracy (5.4% MAPE), suggesting Fox Corporation's revenue trajectory is well-characterized by its spending patterns. Each $1 of SG&A spending generates $7.99 in revenue, reflecting strong commercial efficiency.
Revenue Forecast
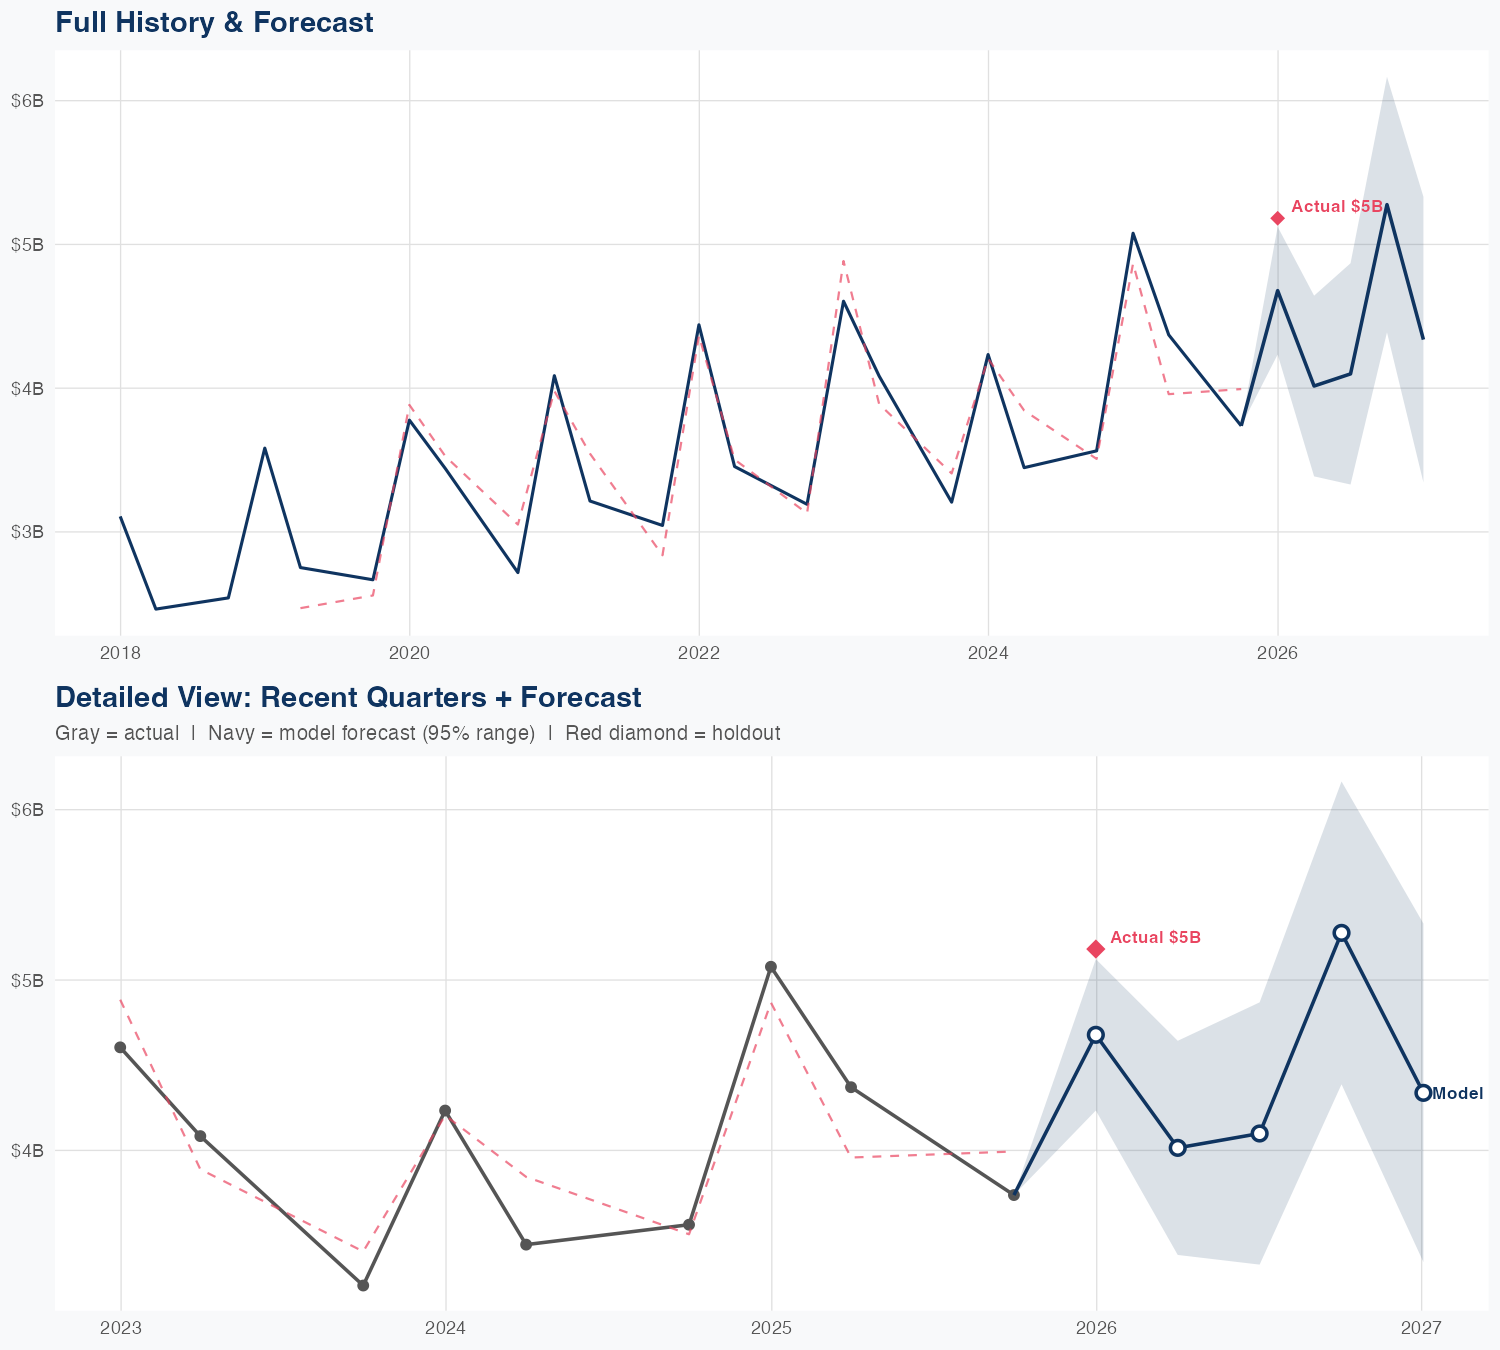
Quarterly Detail
| Quarter | Model Forecast | Actual | 95% Range | YoY Growth | Status |
|---|---|---|---|---|---|
| Q4 2025 | $4.7B | $5.2B | $4.2B – $5.1B | +31.3% | ✗ Outside range |
| Q2 2026 | $4.0B | $3.4B – $4.6B | -20.9% | ||
| Q3 2026 | $4.1B | $3.3B – $4.9B | -6.2% | ||
| Q4 2026 | $5.3B | $4.4B – $6.2B | +41.2% | ||
| Q1 2027 | $4.3B | $3.3B – $5.3B | -16.3% |
Seasonal Factors
| Fiscal Quarter | Seasonal Factor | vs Trend | Interpretation | Obs. |
|---|---|---|---|---|
| FQ1 (Sep–Nov) | 1.016 | +1.6% | In line with trend | 7 |
| FQ2 (Dec–Feb) | 1.0171 | +1.7% | In line with trend | 7 |
| FQ3 (Mar–May) | 0.9861 | -1.4% | In line with trend | 7 |
| FQ4 (Jun–Aug) | 1.0 | +0.0% | In line with trend | 0 |
How Spending Drives Revenue
Want this analysis for your portfolio?
I build custom revenue intelligence reports for investors and companies using SEC filing data, econometric modeling, and AI-powered insights.
Get in Touch