Idex Corp IEX
Revenue Intelligence Report • 66 quarters of SEC filing data • Updated 2026-03-15
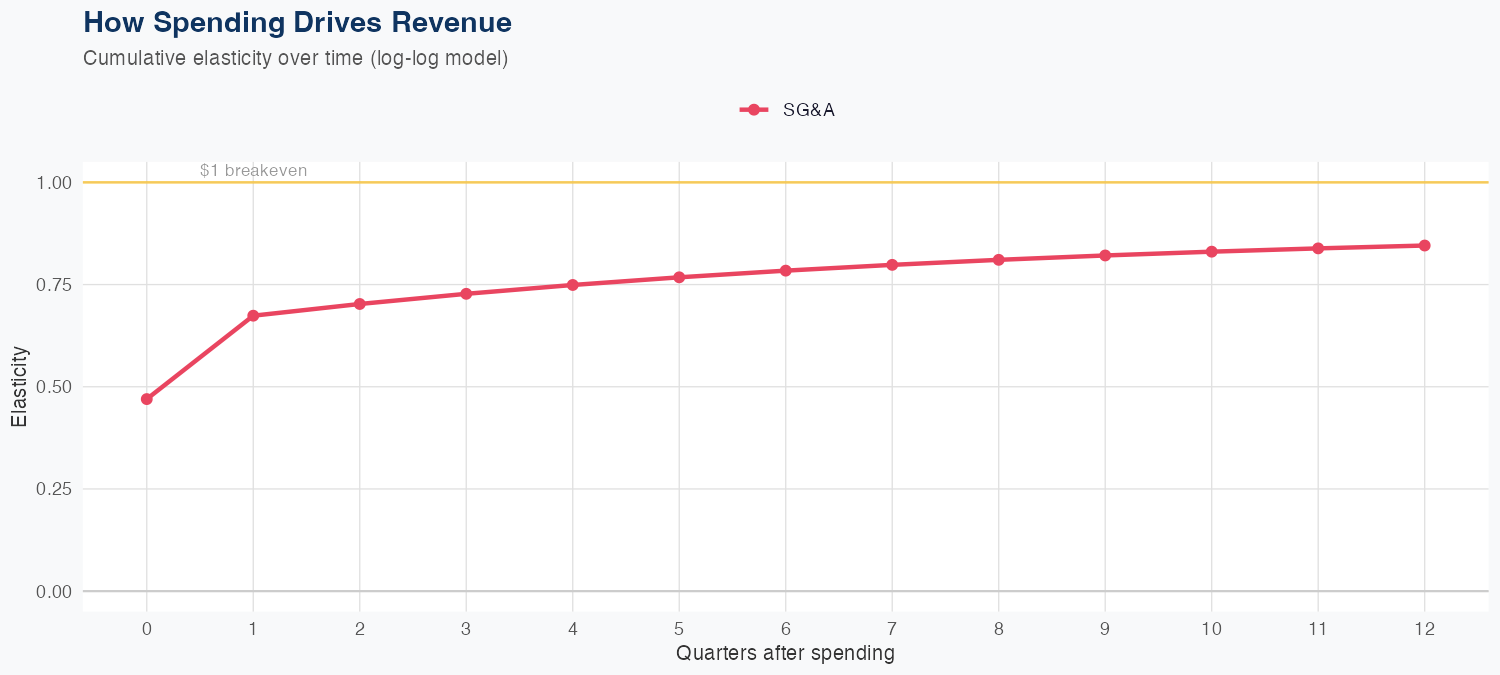
Revenue is moderately sensitive to SG&A spending, with a 1% increase in SG&A associated with a 0.85% rise in revenue, per the log-log model. The model uses 66 quarters of data and achieves 2.1% MAPE, with a holdout test predicting 902M versus actual 899M (−0.3% error). The latest quarterly revenue was 899M; the FY forecast is 3,808M, up 10.1% year over year. This SG&A–driven revenue leverage implies a positive ROI on spending, supporting a constructive outlook if margins stay stable and forecast growth persists.
Investment Thesis
Our ARDL model tracks Idex Corp's revenue with exceptional precision (2.1% MAPE), indicating highly predictable cash flows. Sales & marketing spend shows a 0.85x elasticity, suggesting effective go-to-market execution.
Revenue Forecast
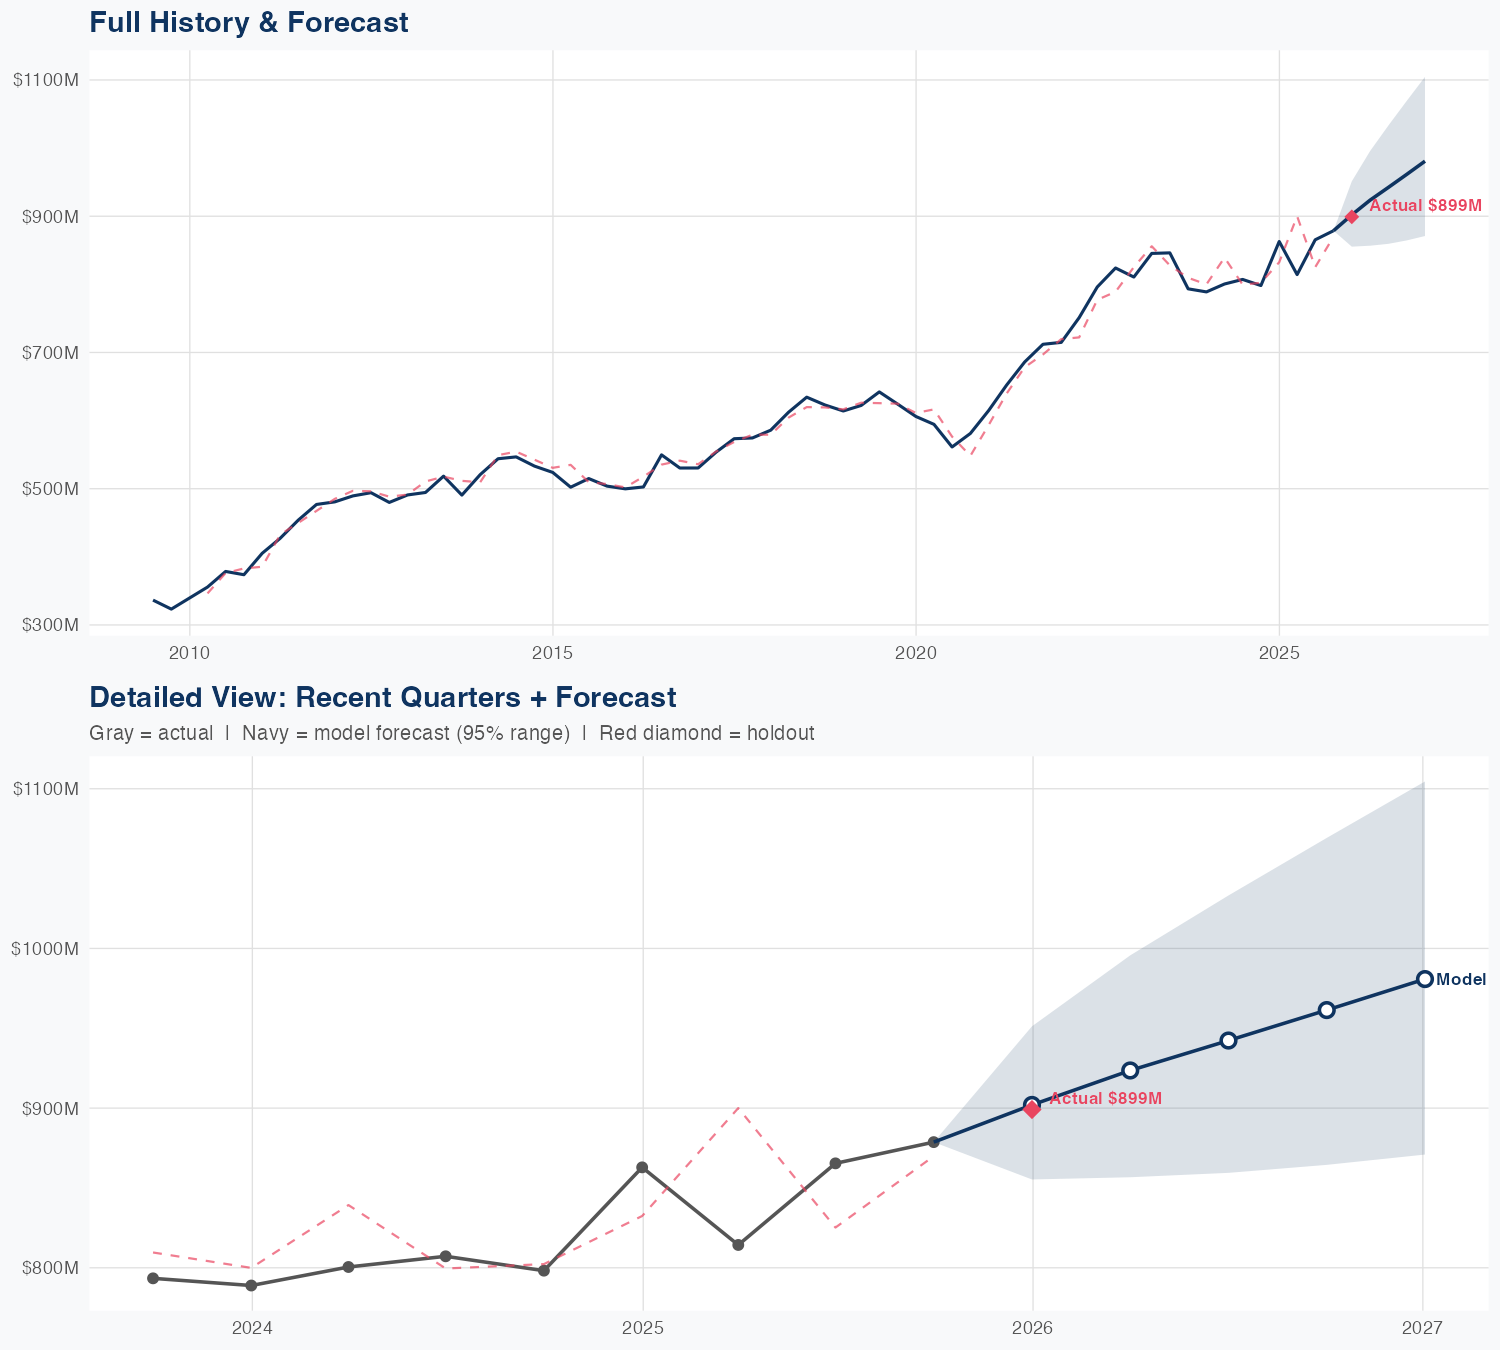
Quarterly Detail
| Quarter | Model Forecast | Actual | 95% Range | YoY Growth | Status |
|---|---|---|---|---|---|
| Q4 2025 | $902B | $899B | $855B – $951B | +4.5% | ✓ In range |
| Q2 2026 | $924B | $857B – $996B | +13.4% | ||
| Q3 2026 | $942B | $859B – $1033B | +8.9% | ||
| Q4 2026 | $961B | $864B – $1069B | +9.4% | ||
| Q1 2027 | $981B | $871B – $1105B | +9.1% |
Seasonal Factors
| Fiscal Quarter | Seasonal Factor | vs Trend | Interpretation | Obs. |
|---|---|---|---|---|
| FQ1 (Sep–Nov) | 0.9949 | -0.5% | In line with trend | 16 |
| FQ2 (Dec–Feb) | 0.9961 | -0.4% | In line with trend | 16 |
| FQ3 (Mar–May) | 0.9878 | -1.2% | In line with trend | 16 |
| FQ4 (Jun–Aug) | 1.0104 | +1.0% | In line with trend | 16 |
How Spending Drives Revenue
Want this analysis for your portfolio?
I build custom revenue intelligence reports for investors and companies using SEC filing data, econometric modeling, and AI-powered insights.
Get in Touch