Iqvia Holdings Inc. IQV
Revenue Intelligence Report • 56 quarters of SEC filing data • Updated 2026-03-15
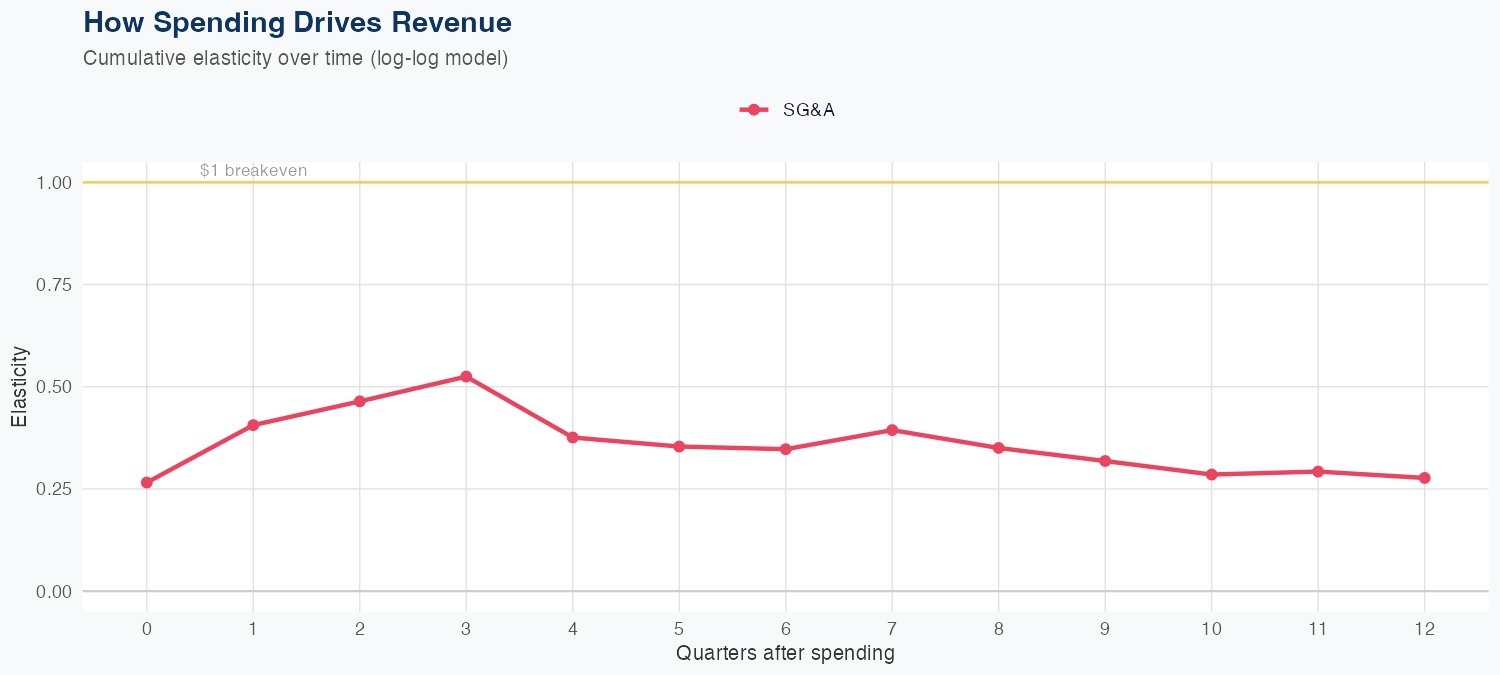
Revenue is driven by a modest positive response to SG&A spending, with a 1% increase in SG&A yielding about a 0.28% rise in revenue, per the log-log model. Model performance is solid, with a 3.4% MAPE and a holdout error of 1.2% (predicted 4.3B vs actual 4.4B), supporting reliability for near-term forecasts. The implied ROI of SG&A investments is limited, given the elasticity, so incremental revenue gains from SG&A are modest and efficiency in spending is key to protecting margins. The FY outlook points to about $17B in revenue, up 4.3% year over year, signaling steady growth with controlled cost progress.
Investment Thesis
The econometric model achieves strong accuracy (3.4% MAPE), suggesting Iqvia Holdings Inc.'s revenue trajectory is well-characterized by its spending patterns. Sales & marketing spend shows a 0.28x elasticity, suggesting effective go-to-market execution.
Revenue Forecast
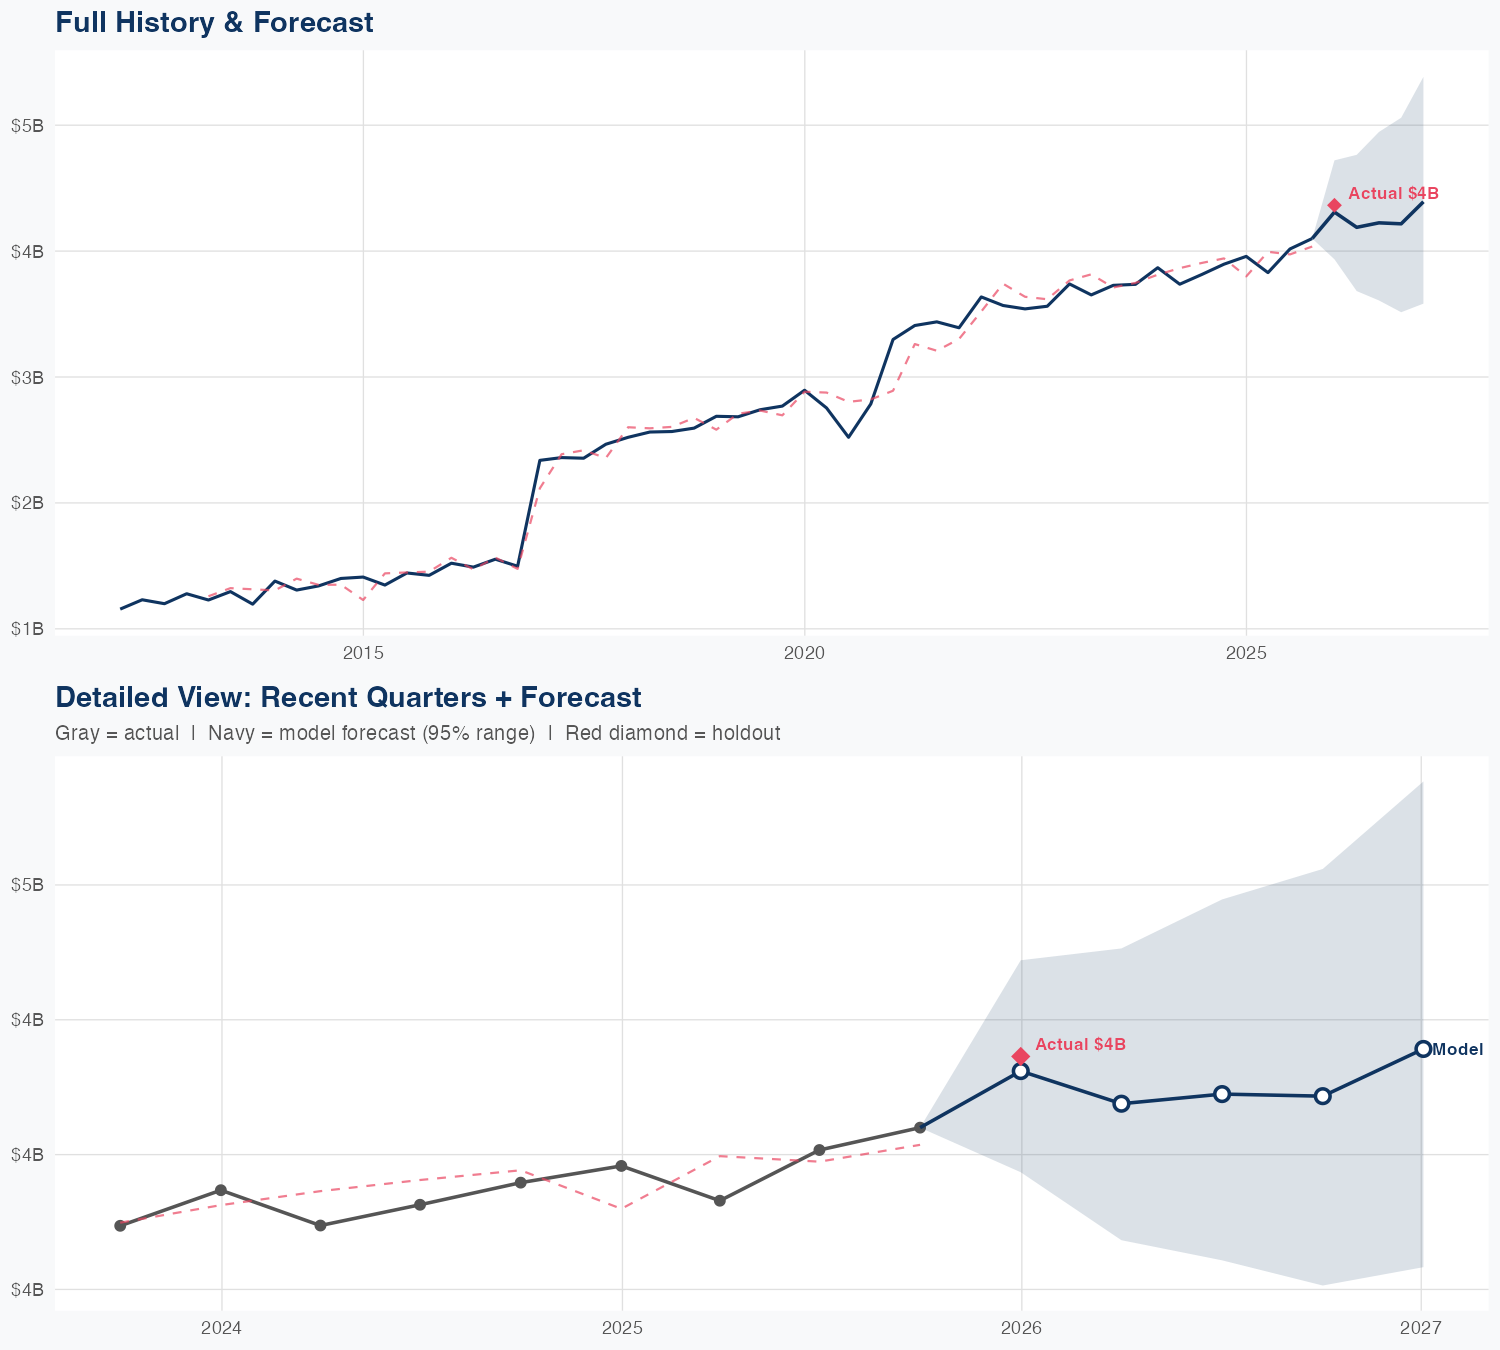
Quarterly Detail
| Quarter | Model Forecast | Actual | 95% Range | YoY Growth | Status |
|---|---|---|---|---|---|
| Q4 2025 | $4.3B | $4.4B | $3.9B – $4.7B | +9.0% | ✓ In range |
| Q2 2026 | $4.2B | $3.7B – $4.8B | +9.4% | ||
| Q3 2026 | $4.2B | $3.6B – $4.9B | +5.2% | ||
| Q4 2026 | $4.2B | $3.5B – $5.0B | +2.7% | ||
| Q1 2027 | $4.4B | $3.6B – $5.4B | +0.6% |
Seasonal Factors
| Fiscal Quarter | Seasonal Factor | vs Trend | Interpretation | Obs. |
|---|---|---|---|---|
| FQ1 (Sep–Nov) | 0.9981 | -0.2% | In line with trend | 13 |
| FQ2 (Dec–Feb) | 1.0295 | +3.0% | In line with trend | 13 |
| FQ3 (Mar–May) | 0.9677 | -3.2% | -3.2% below trend | 13 |
| FQ4 (Jun–Aug) | 0.9898 | -1.0% | In line with trend | 13 |
How Spending Drives Revenue
Want this analysis for your portfolio?
I build custom revenue intelligence reports for investors and companies using SEC filing data, econometric modeling, and AI-powered insights.
Get in Touch