Ingersoll Rand Inc. IR
Revenue Intelligence Report • 38 quarters of SEC filing data • Updated 2026-03-15
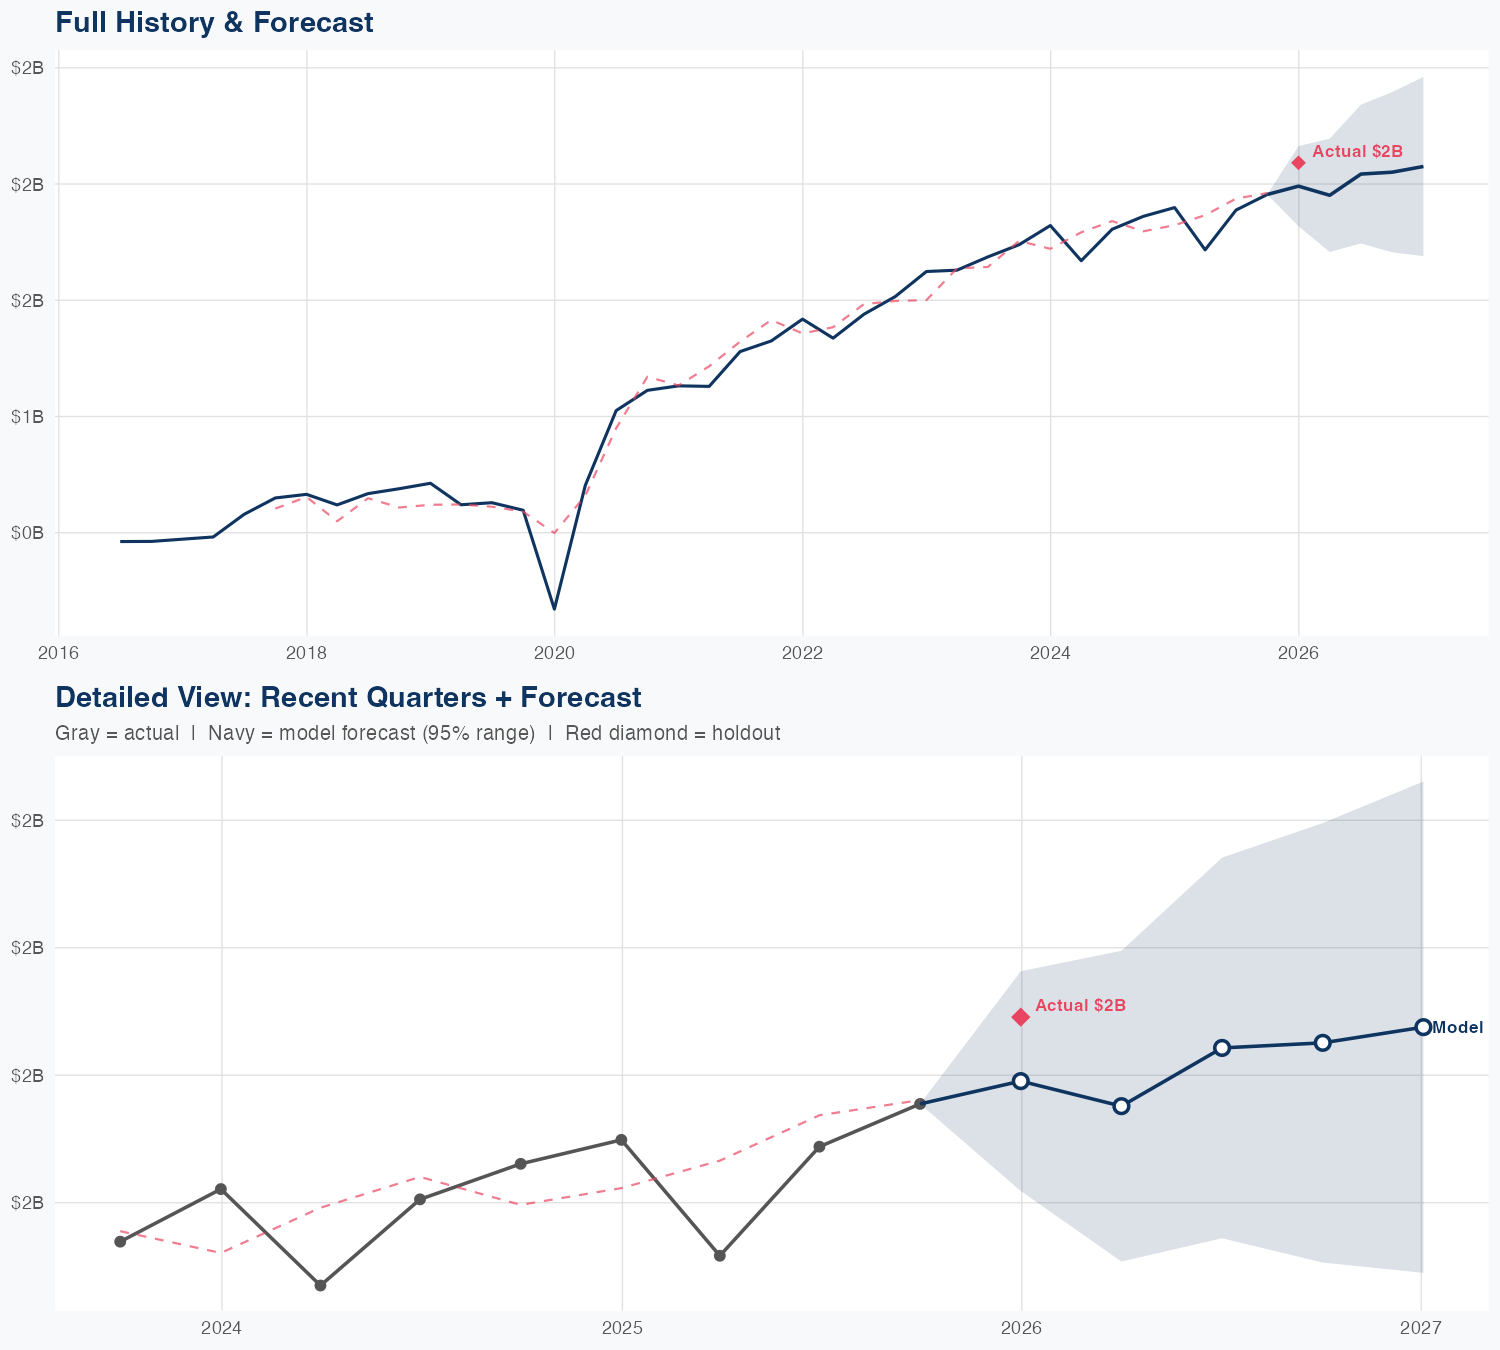
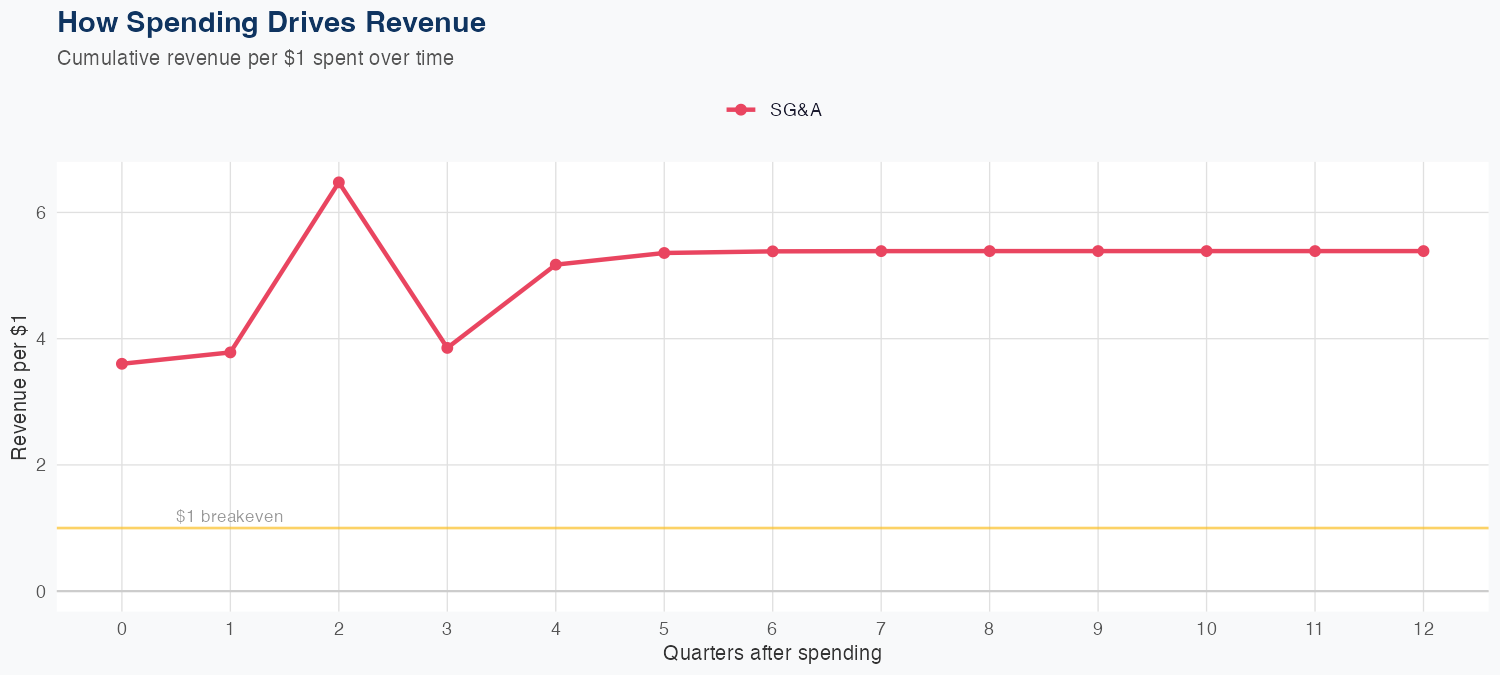
Revenue is driven by strong ROI on SG&A spending, with each dollar of SG&A forecast to generate about $5.39 of long-run revenue. The most recent quarter posted $2.091 billion in revenue. The forecasting approach is linear, with an overall MAPE of 10.1% and a holdout error of 4.8% (2.0B predicted vs 2.1B actual), indicating reasonable forecast reliability. The full-year revenue outlook is $8.1 billion, up 6.1% year over year, signaling solid growth supported by operating efficiency.
Investment Thesis
At 10.1% MAPE, the model captures Ingersoll Rand Inc.'s broad revenue trajectory, though quarterly variability suggests sensitivity to external factors. Each $1 of SG&A spending generates $5.39 in revenue, reflecting strong commercial efficiency.
Revenue Forecast
Quarterly Detail
| Quarter | Model Forecast | Actual | 95% Range | YoY Growth | Status |
|---|---|---|---|---|---|
| Q4 2025 | $2.0B | $2.1B | $1.8B – $2.2B | +4.9% | ✓ In range |
| Q2 2026 | $2.0B | $1.7B – $2.2B | +13.7% | ||
| Q3 2026 | $2.0B | $1.7B – $2.3B | +8.2% | ||
| Q4 2026 | $2.1B | $1.7B – $2.4B | +4.9% | ||
| Q1 2027 | $2.1B | $1.7B – $2.5B | -0.8% |
Seasonal Factors
| Fiscal Quarter | Seasonal Factor | vs Trend | Interpretation | Obs. |
|---|---|---|---|---|
| FQ1 (Sep–Nov) | 1.0103 | +1.0% | In line with trend | 9 |
| FQ2 (Dec–Feb) | 1.0455 | +4.5% | +4.5% above trend | 9 |
| FQ3 (Mar–May) | 0.9952 | -0.5% | In line with trend | 8 |
| FQ4 (Jun–Aug) | 1.0263 | +2.6% | In line with trend | 8 |
How Spending Drives Revenue
Want this analysis for your portfolio?
I build custom revenue intelligence reports for investors and companies using SEC filing data, econometric modeling, and AI-powered insights.
Get in Touch