Jack Henry & Associates, Inc. JKHY
Revenue Intelligence Report • 32 quarters of SEC filing data • Updated 2026-03-15
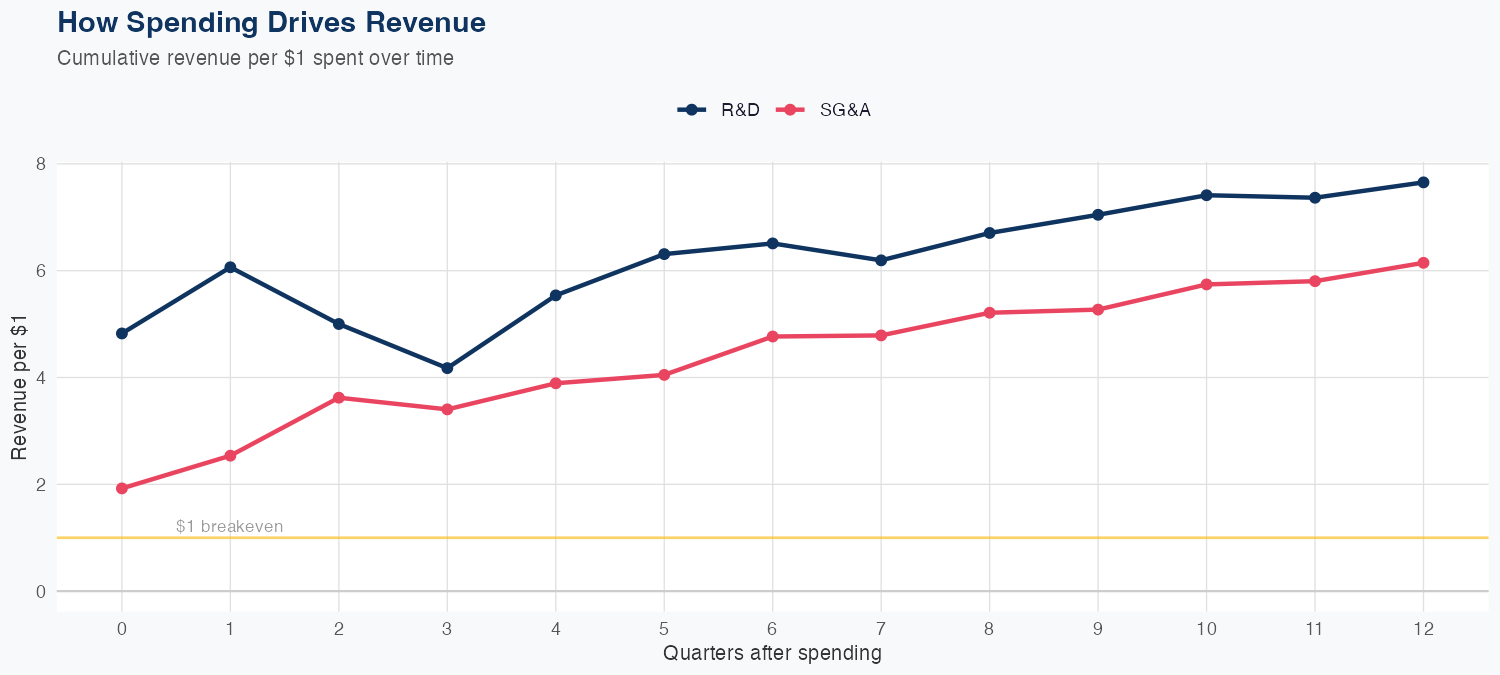
Revenue is driven by disciplined investments in R&D and SG&A, which translate to long-run revenue returns of $7.65 per $1 of R&D and $6.15 per $1 of SG&A. The model is linear and supported by 32 quarters of data, with 1.0% MAPE and a holdout test error of 2.6% (predicted 374M vs actual 384M). Latest quarterly revenue was 384M, and the FY forecast is 1,512M, up 5.7% year over year. This points to a stable, ROI-driven growth trajectory, though the outlook remains mindful of macro and competitive dynamics that could affect spend efficiency.
Investment Thesis
Our ARDL model tracks Jack Henry & Associates, Inc.'s revenue with exceptional precision (1.0% MAPE), indicating highly predictable cash flows. Every $1 of R&D investment is associated with $7.65 of revenue, indicating efficient capital deployment in innovation. Each $1 of SG&A spending generates $6.15 in revenue, reflecting strong commercial efficiency.
Revenue Forecast
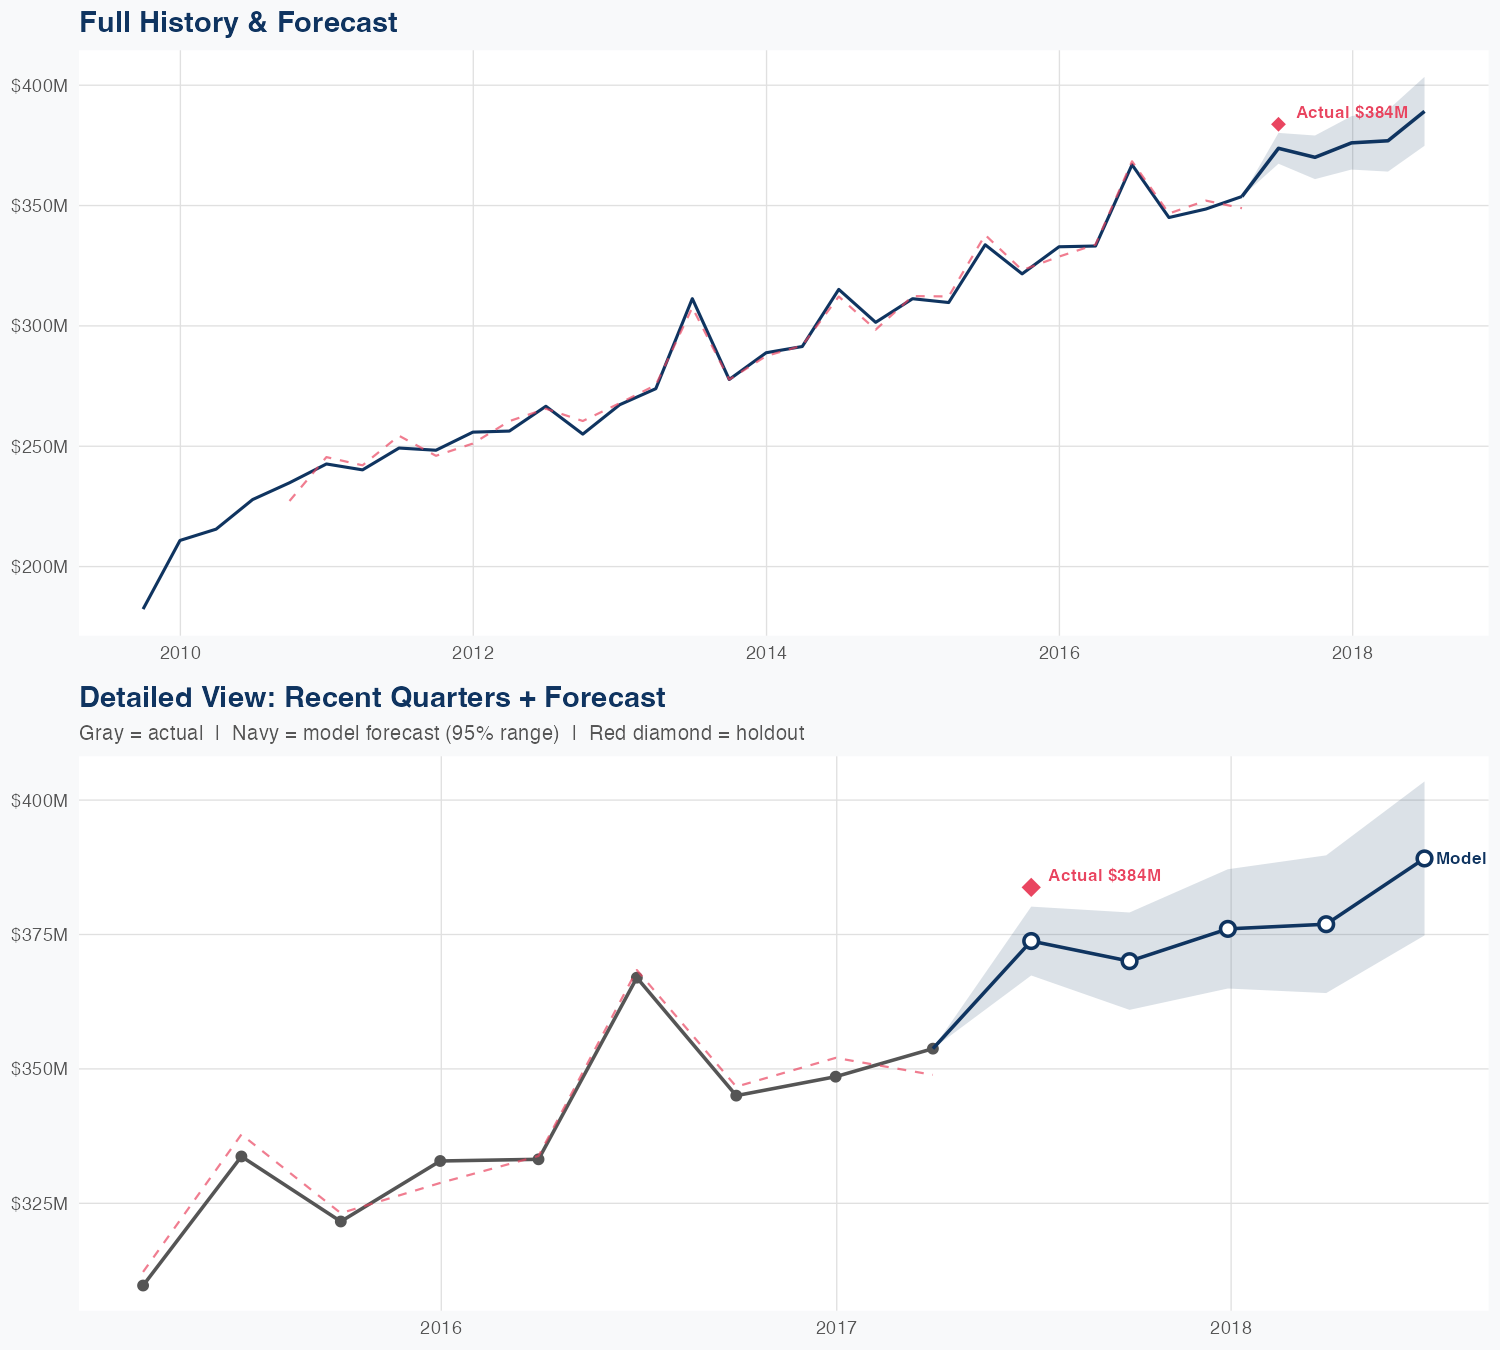
Quarterly Detail
| Quarter | Model Forecast | Actual | 95% Range | YoY Growth | Status |
|---|---|---|---|---|---|
| Q2 2017 | $374B | $384B | $367B – $380B | +1.9% | ✗ Outside range |
| Q3 2017 | $370B | $361B – $379B | +7.2% | ||
| Q4 2017 | $376B | $365B – $387B | +7.9% | ||
| Q1 2018 | $377B | $364B – $390B | +6.5% | ||
| Q2 2018 | $389B | $375B – $403B | +1.4% |
Seasonal Factors
| Fiscal Quarter | Seasonal Factor | vs Trend | Interpretation | Obs. |
|---|---|---|---|---|
| FQ1 (Sep–Nov) | 1.0002 | +0.0% | In line with trend | 7 |
| FQ2 (Dec–Feb) | 0.9976 | -0.2% | In line with trend | 7 |
| FQ3 (Mar–May) | 0.9945 | -0.5% | In line with trend | 7 |
| FQ4 (Jun–Aug) | 1.0039 | +0.4% | In line with trend | 7 |
How Spending Drives Revenue
Want this analysis for your portfolio?
I build custom revenue intelligence reports for investors and companies using SEC filing data, econometric modeling, and AI-powered insights.
Get in Touch