Johnson & Johnson JNJ
Revenue Intelligence Report • 41 quarters of SEC filing data • Updated 2026-03-15
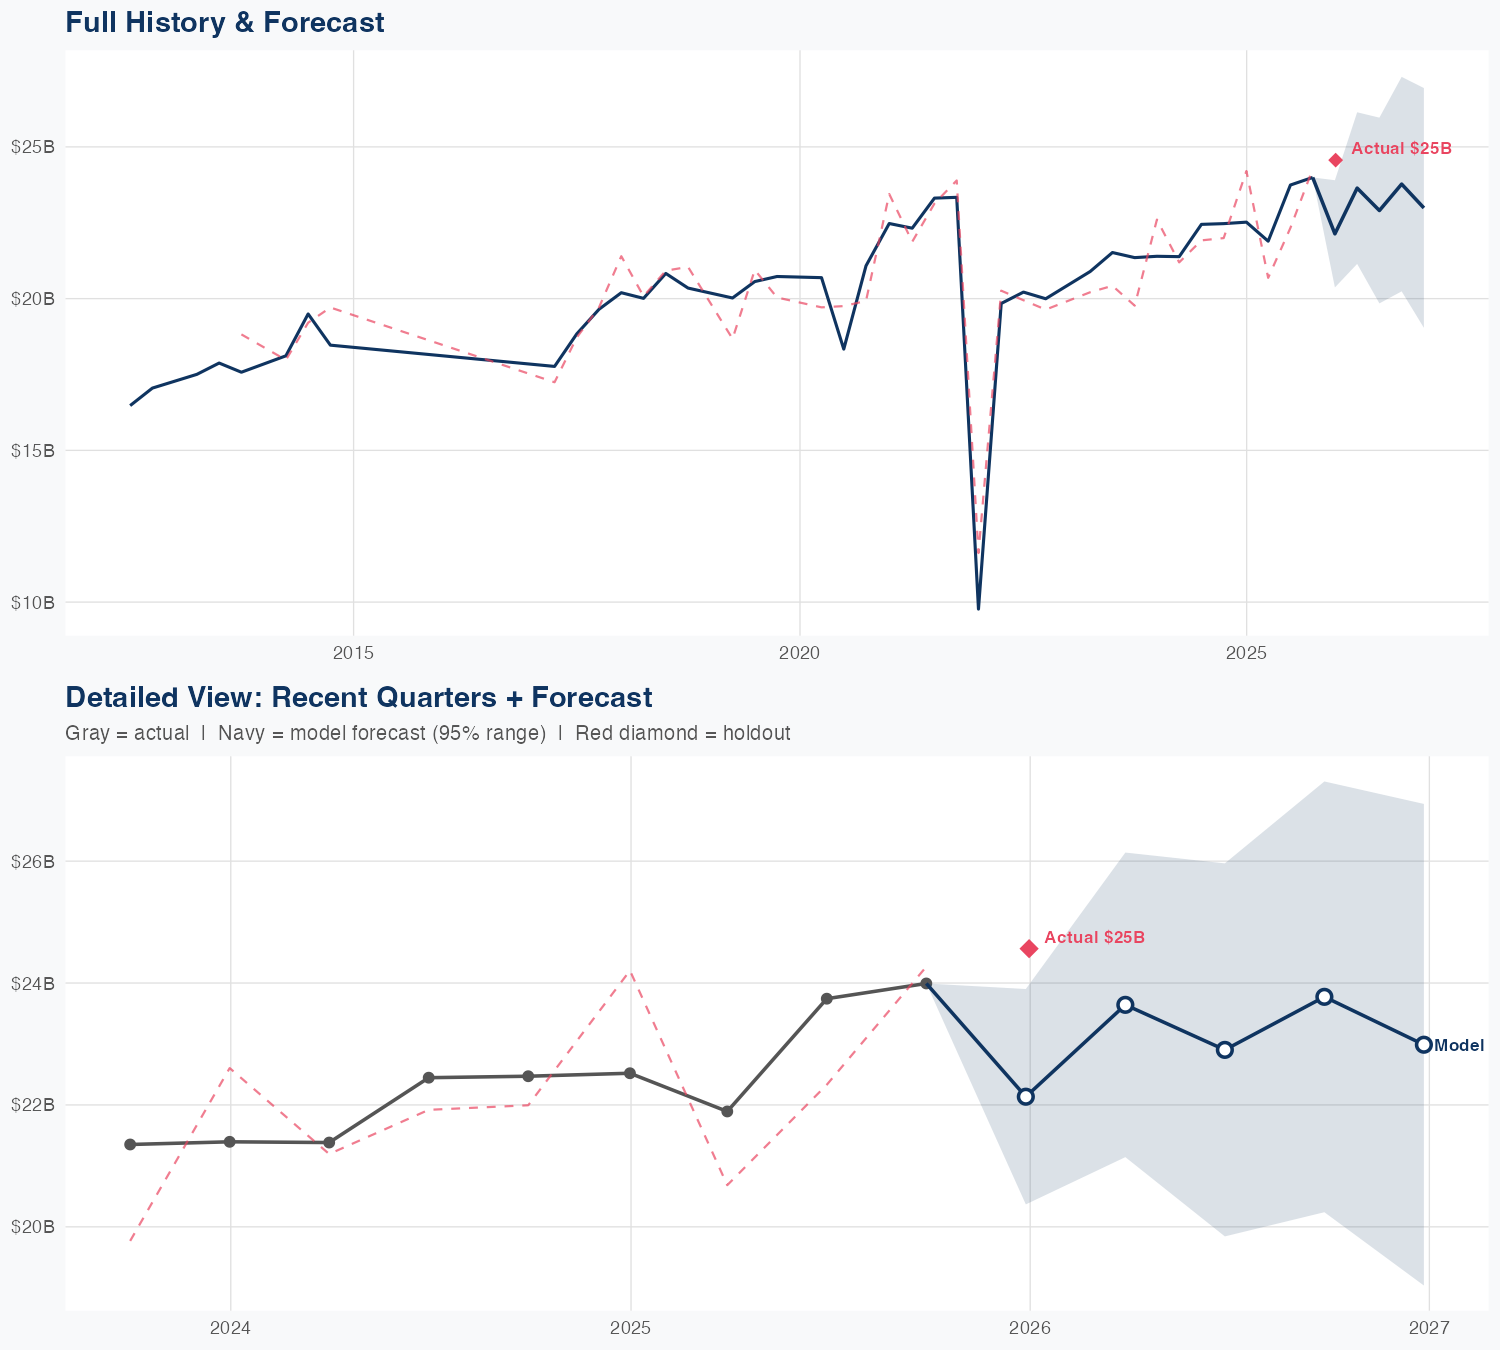
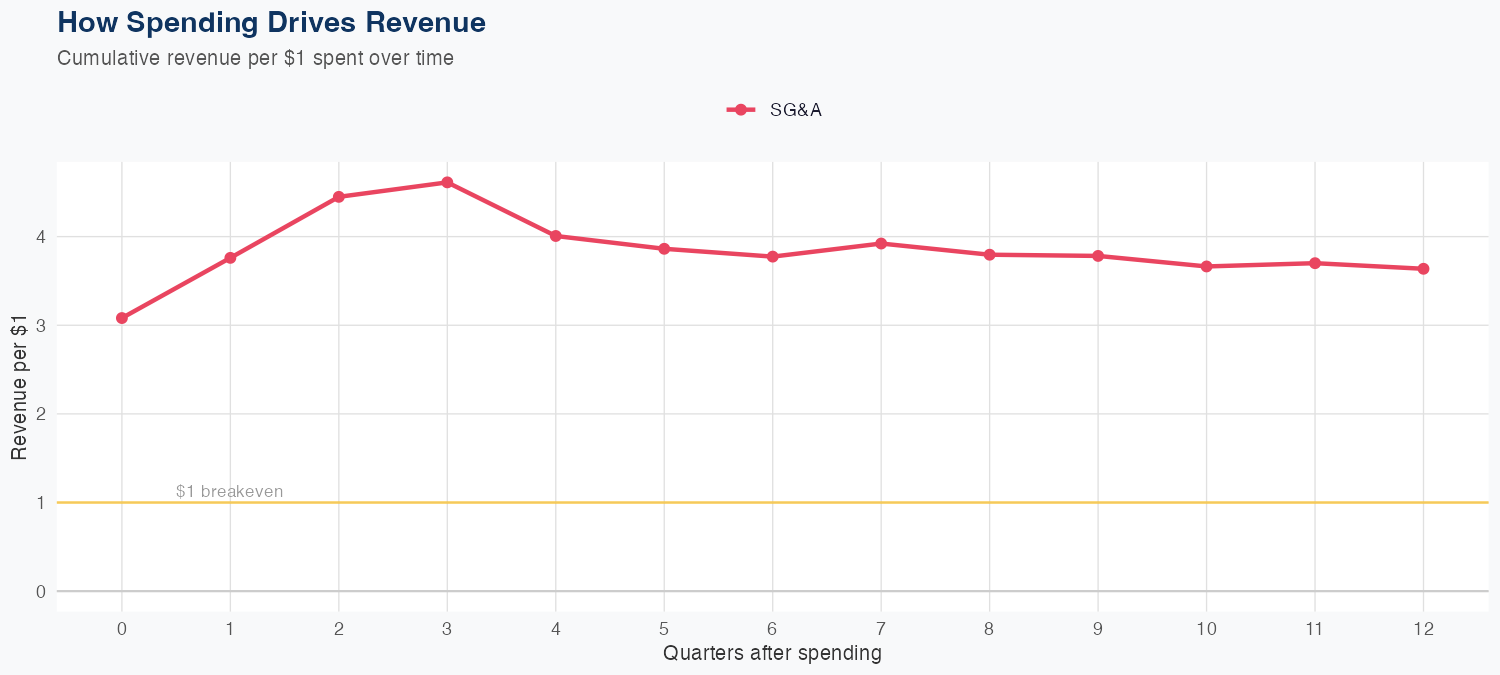
Johnson & Johnson posted FY revenue of $93B with a -0.9% YoY, signaling a stable base but no accelerating growth. Our econometric model suggests growth is anchored in the commercial engine—SG&A-driven market access and pricing—rather than an outsized R&D push or a rapid product-cycle ramp. SG&A ROI of $3.64 per $1 implies each dollar of SG&A spend translates into roughly $3.64 of revenue, underscoring that scale and execution across a diversified portfolio are the main growth drivers at this stage. The holdout was about -9.9% (predicted $22.1B vs actual $24.6B), highlighting modest forecast reliability and suggesting catalysts like launches or reimbursement shifts aren’t fully captured; growth remains exposed to pricing/regulatory risk and mix shifts across pharma, devices, and consumer health.
Investment Thesis
The econometric model achieves strong accuracy (3.8% MAPE), suggesting Johnson & Johnson's revenue trajectory is well-characterized by its spending patterns. Each $1 of SG&A spending generates $3.64 in revenue, reflecting strong commercial efficiency.
Revenue Forecast
Quarterly Detail
| Quarter | Model Forecast | Actual | 95% Range | YoY Growth | Status |
|---|---|---|---|---|---|
| Q4 2025 | $22B | $25B | $20B – $24B | -1.7% | ✗ Outside range |
| Q1 2026 | $24B | $21B – $26B | +8.0% | ||
| Q2 2026 | $23B | $20B – $26B | -3.5% | ||
| Q3 2026 | $24B | $20B – $27B | -0.9% | ||
| Q4 2026 | $23B | $19B – $27B | -6.4% |
Seasonal Factors
| Fiscal Quarter | Seasonal Factor | vs Trend | Interpretation | Obs. |
|---|---|---|---|---|
| FQ1 (Sep–Nov) | 0.9968 | -0.3% | In line with trend | 11 |
| FQ2 (Dec–Feb) | 0.9465 | -5.4% | -5.4% below trend | 6 |
| FQ3 (Mar–May) | 1.0303 | +3.0% | +3.0% above trend | 10 |
| FQ4 (Jun–Aug) | 1.0135 | +1.3% | In line with trend | 10 |
How Spending Drives Revenue
Want this analysis for your portfolio?
I build custom revenue intelligence reports for investors and companies using SEC filing data, econometric modeling, and AI-powered insights.
Get in Touch