Coca Cola Co KO
Revenue Intelligence Report • 33 quarters of SEC filing data • Updated 2026-03-15
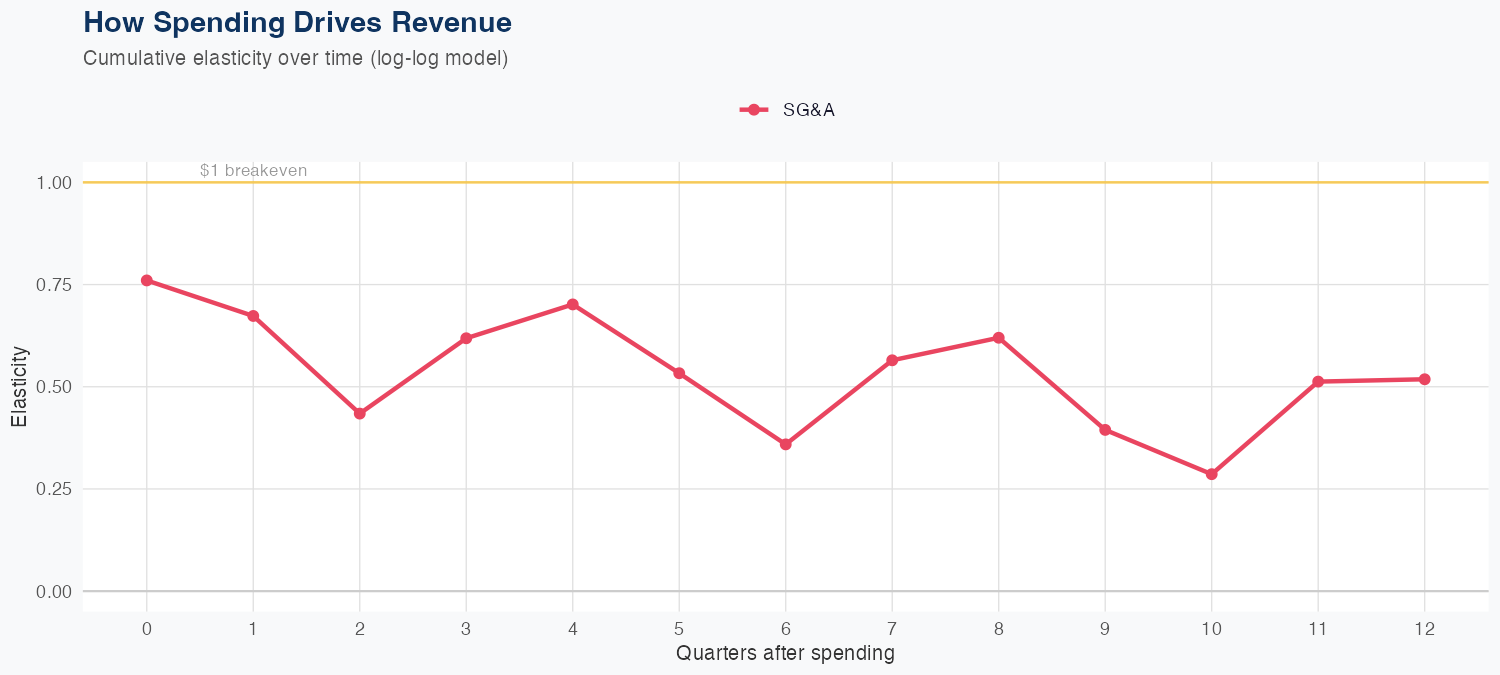
Revenue is driven by selling, general and administrative spending, with an elasticity of 0.52 (a 1% SG&A increase associates with a 0.52% revenue rise), indicating a positive but modest ROI from marketing and distribution efforts. The model uses a log-log framework and achieves 2.4% MAPE, though a holdout forecast undershot by about 1B (11B predicted vs 12B actual, 10.7% error), signaling some near-term forecast uncertainty. The FY revenue forecast is 48B, down 0.9% year over year, implying a modest revenue pause despite continued brand strength and broad distribution. Outlook for investors suggests SG&A delivers positive but limited ROI, with revenue stabilizing in the high 40s billions; ongoing attention to pricing, product mix, and marketing intensity will be important to sustain top-line growth.
Investment Thesis
Our ARDL model tracks Coca Cola Co's revenue with exceptional precision (2.4% MAPE), indicating highly predictable cash flows. Sales & marketing spend shows a 0.52x elasticity, suggesting effective go-to-market execution.
Revenue Forecast
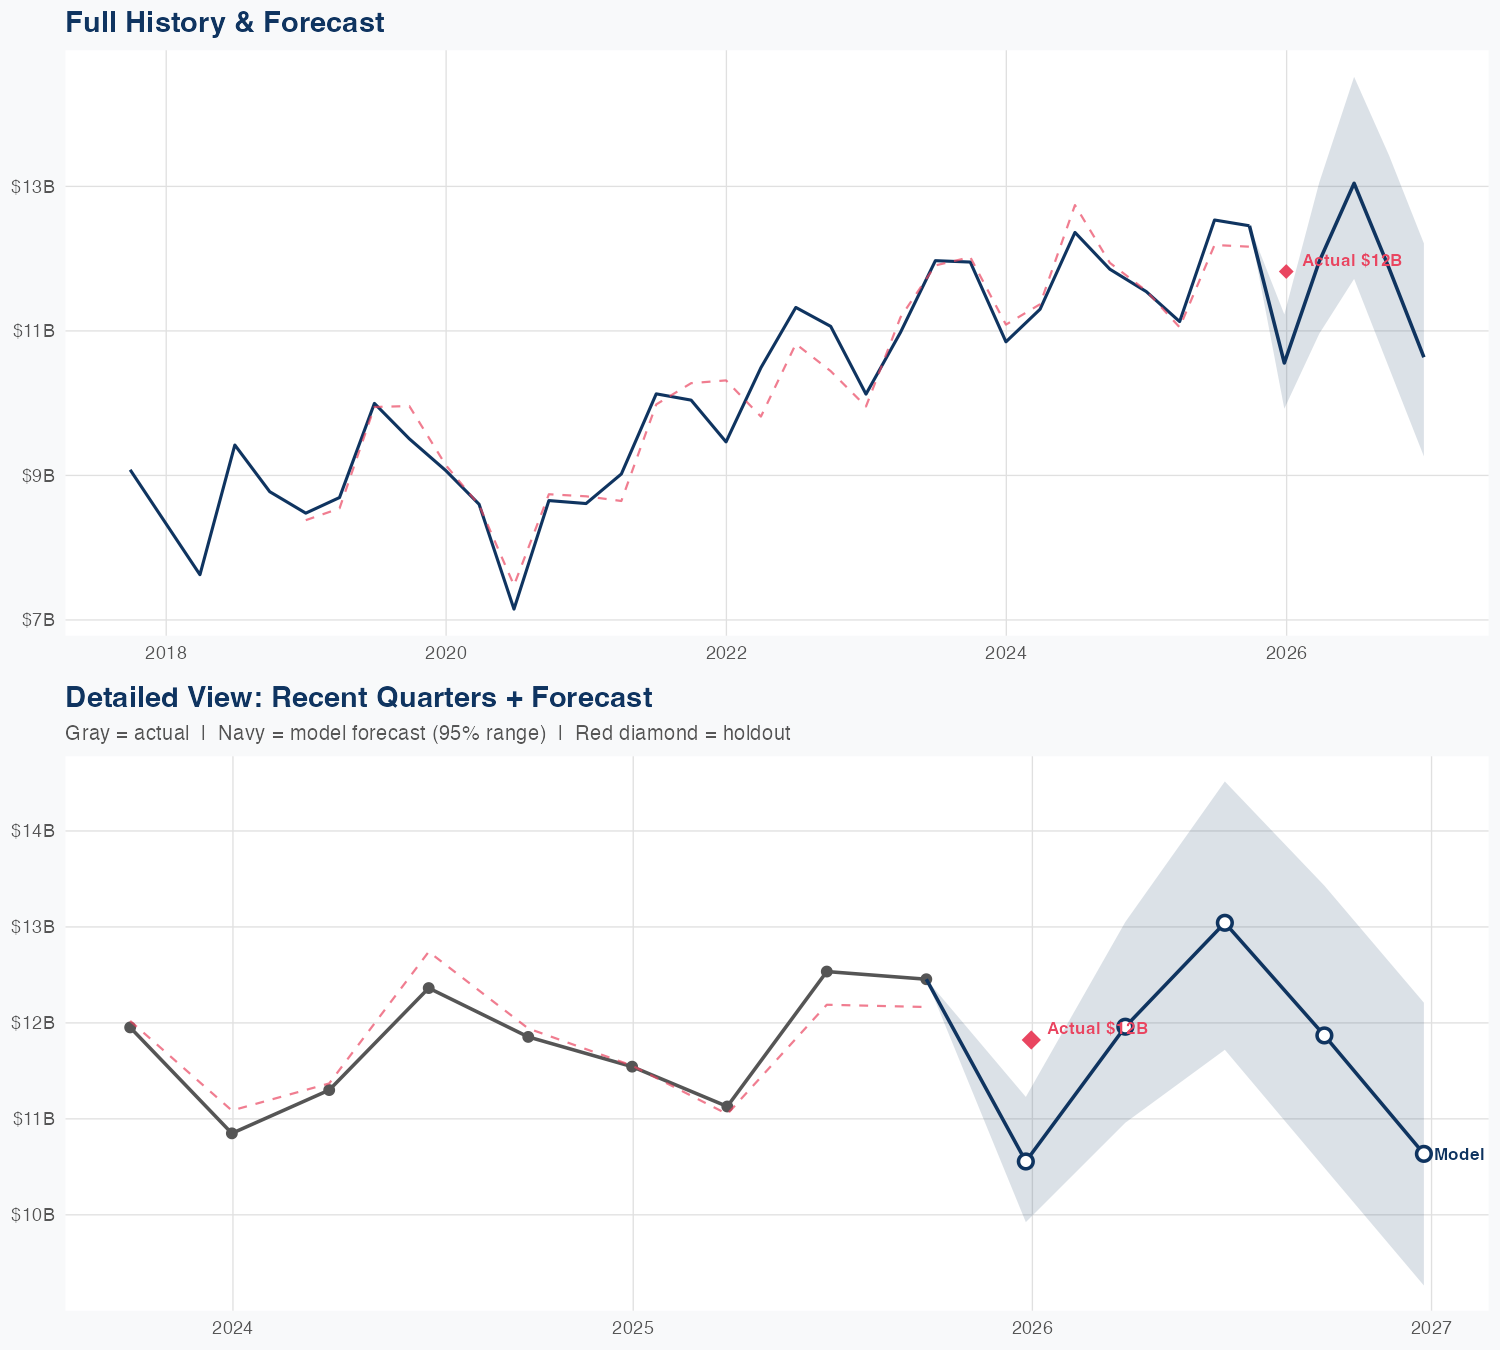
Quarterly Detail
| Quarter | Model Forecast | Actual | 95% Range | YoY Growth | Status |
|---|---|---|---|---|---|
| Q4 2025 | $11B | $12B | $9.9B – $11B | -8.6% | ✗ Outside range |
| Q1 2026 | $12B | $11B – $13B | +7.5% | ||
| Q2 2026 | $13B | $12B – $15B | +4.1% | ||
| Q3 2026 | $12B | $10B – $13B | -4.7% | ||
| Q4 2026 | $11B | $9.3B – $12B | -10.0% |
Seasonal Factors
| Fiscal Quarter | Seasonal Factor | vs Trend | Interpretation | Obs. |
|---|---|---|---|---|
| FQ1 (Sep–Nov) | 0.9926 | -0.7% | In line with trend | 7 |
| FQ2 (Dec–Feb) | 0.9918 | -0.8% | In line with trend | 8 |
| FQ3 (Mar–May) | 1.0072 | +0.7% | In line with trend | 7 |
| FQ4 (Jun–Aug) | 1.0055 | +0.5% | In line with trend | 7 |
How Spending Drives Revenue
Want this analysis for your portfolio?
I build custom revenue intelligence reports for investors and companies using SEC filing data, econometric modeling, and AI-powered insights.
Get in Touch