Mccormick & Co Inc MKC
Revenue Intelligence Report • 54 quarters of SEC filing data • Updated 2026-03-15
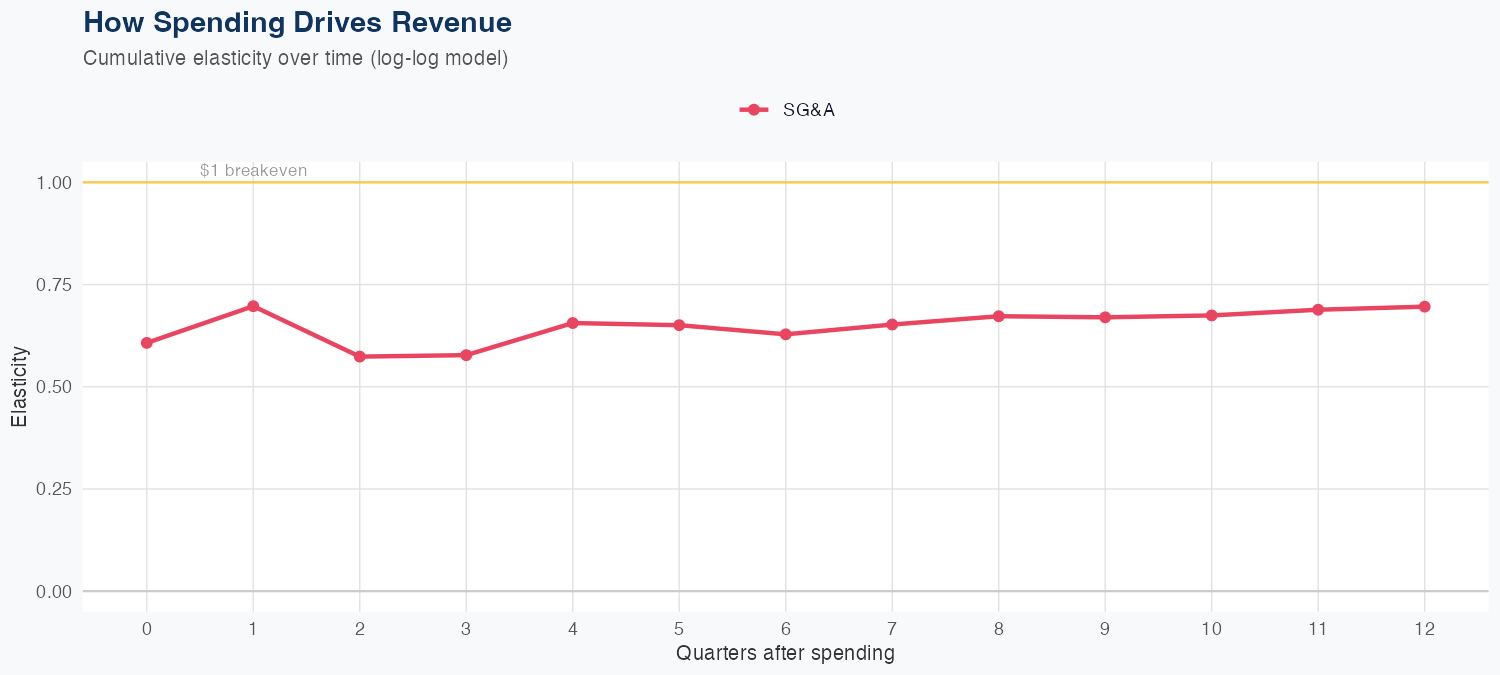
Revenue is driven primarily by selling and administrative spend, with the model showing a 1% increase in SG&A yielding about a 0.70% rise in revenue, indicating marketing and commercial investments have positive but modest leverage. R&D data is not available, so ROI from innovation spending cannot be assessed in this framework. For the fiscal year, revenue is forecast at $6.8 billion, essentially flat year over year at about -0.1%, implying limited top-line growth despite current-quarter strength. The model delivers 2.8% MAPE accuracy, but a holdout test showed an 8% error (predicted $1.7B vs actual $1.9B), signaling some near-term forecast uncertainty despite the elasticity-driven view.
Investment Thesis
Our ARDL model tracks Mccormick & Co Inc's revenue with exceptional precision (2.8% MAPE), indicating highly predictable cash flows. Sales & marketing spend shows a 0.70x elasticity, suggesting effective go-to-market execution.
Revenue Forecast
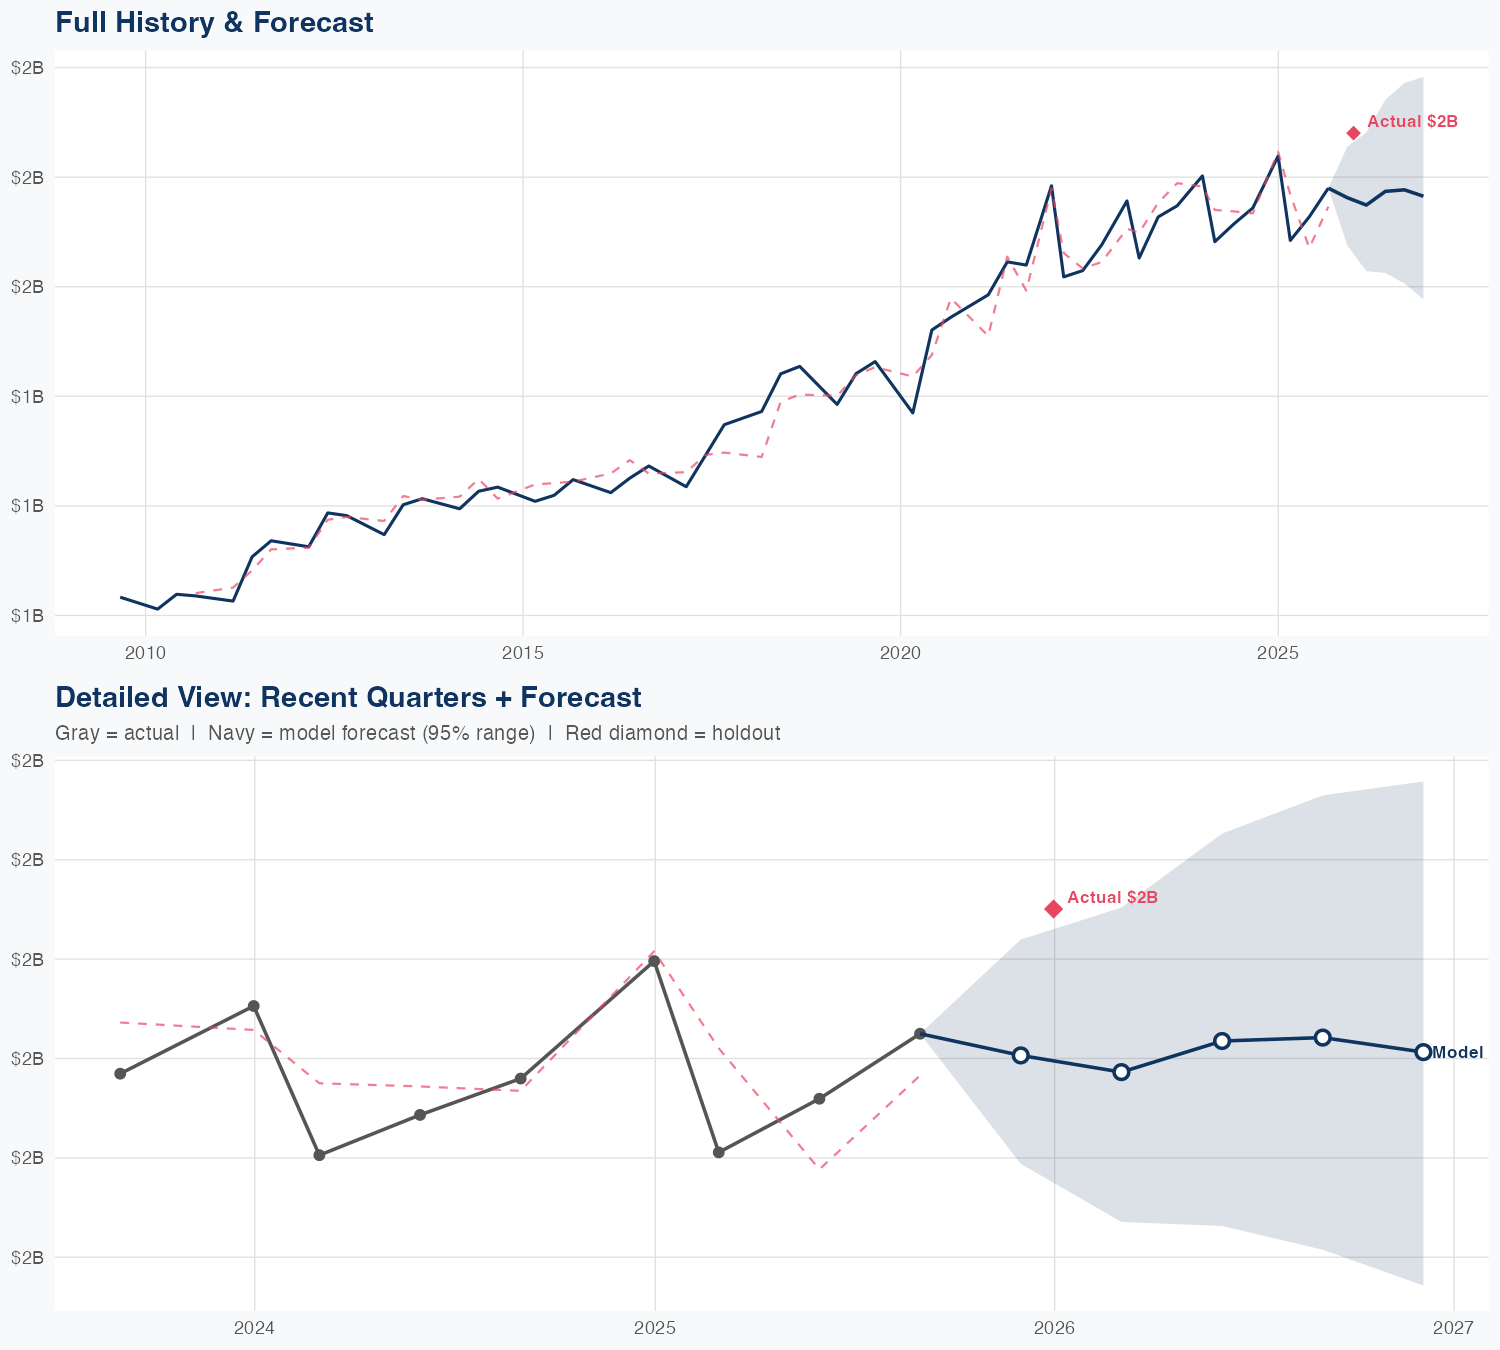
Quarterly Detail
| Quarter | Model Forecast | Actual | 95% Range | YoY Growth | Status |
|---|---|---|---|---|---|
| Q4 2025 | $1.7B | $1.9B | $1.6B – $1.8B | -5.3% | ✗ Outside range |
| Q1 2026 | $1.7B | $1.5B – $1.9B | +5.0% | ||
| Q2 2026 | $1.7B | $1.5B – $1.9B | +3.5% | ||
| Q3 2026 | $1.7B | $1.5B – $2.0B | -0.2% | ||
| Q4 2026 | $1.7B | $1.5B – $2.0B | -7.8% |
Seasonal Factors
| Fiscal Quarter | Seasonal Factor | vs Trend | Interpretation | Obs. |
|---|---|---|---|---|
| FQ1 (Sep–Nov) | 1.0 | +0.0% | In line with trend | 0 |
| FQ2 (Dec–Feb) | 0.973 | -2.7% | In line with trend | 20 |
| FQ3 (Mar–May) | 0.9968 | -0.3% | In line with trend | 15 |
| FQ4 (Jun–Aug) | 1.0161 | +1.6% | In line with trend | 16 |
How Spending Drives Revenue
Want this analysis for your portfolio?
I build custom revenue intelligence reports for investors and companies using SEC filing data, econometric modeling, and AI-powered insights.
Get in Touch