o Reilly Automotive Inc ORLY
Revenue Intelligence Report • 68 quarters of SEC filing data • Updated 2026-03-15
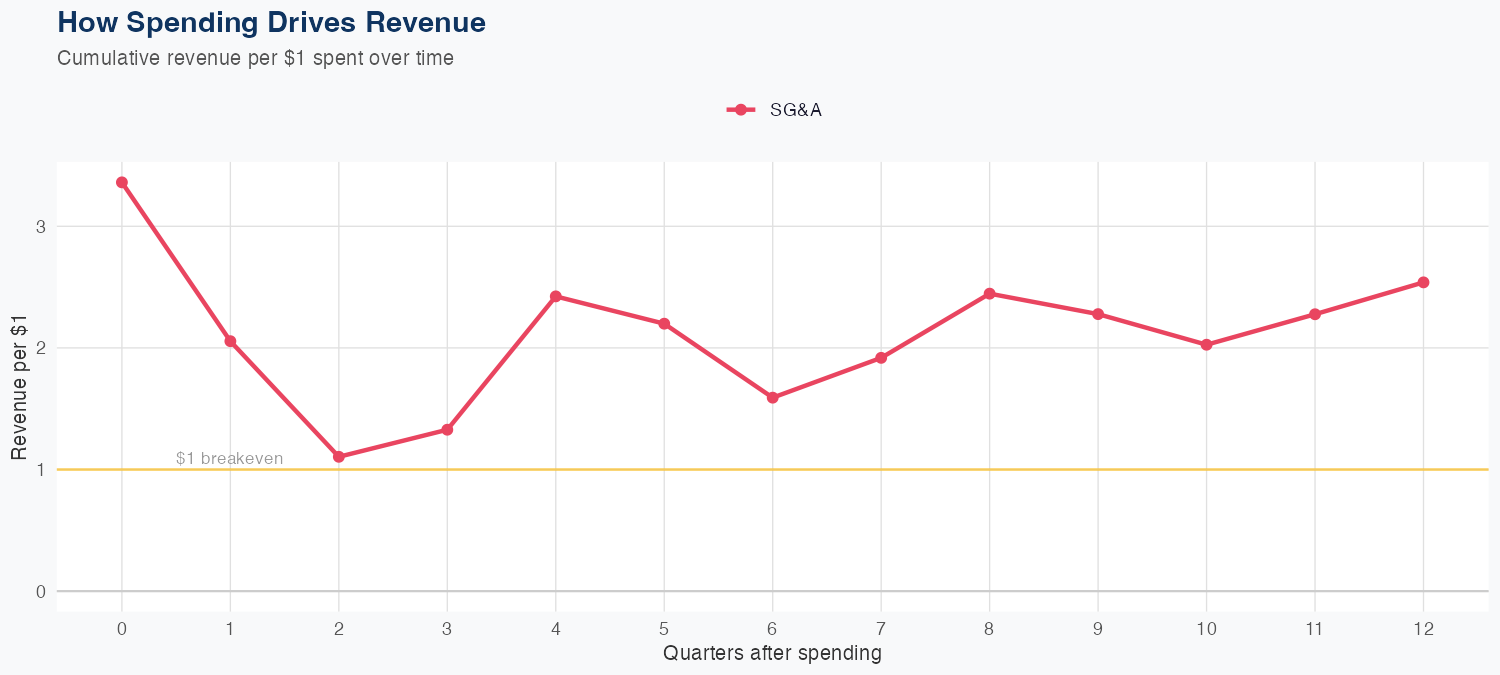
Revenue growth is driven by strong SG&A leverage, with every $1 of SG&A spending generating $2.54 of long-run revenue, while the latest quarterly revenue was about $4.414B. The forecasting model shows solid accuracy (2.0% MAPE) and a holdout miss of -2.2% (predicted $4.5B vs actual $4.4B), indicating reliable near-term projections. The FY forecast calls for roughly $19B in revenue, up 8.8% year over year, signaling continued growth momentum. With proven SG&A ROI and a stable, linear model over 68 quarters, the outlook supports continued revenue expansion provided SG&A investments remain efficiently deployed.
Investment Thesis
Our ARDL model tracks o Reilly Automotive Inc's revenue with exceptional precision (2.0% MAPE), indicating highly predictable cash flows. Each $1 of SG&A spending generates $2.54 in revenue, reflecting strong commercial efficiency.
Revenue Forecast
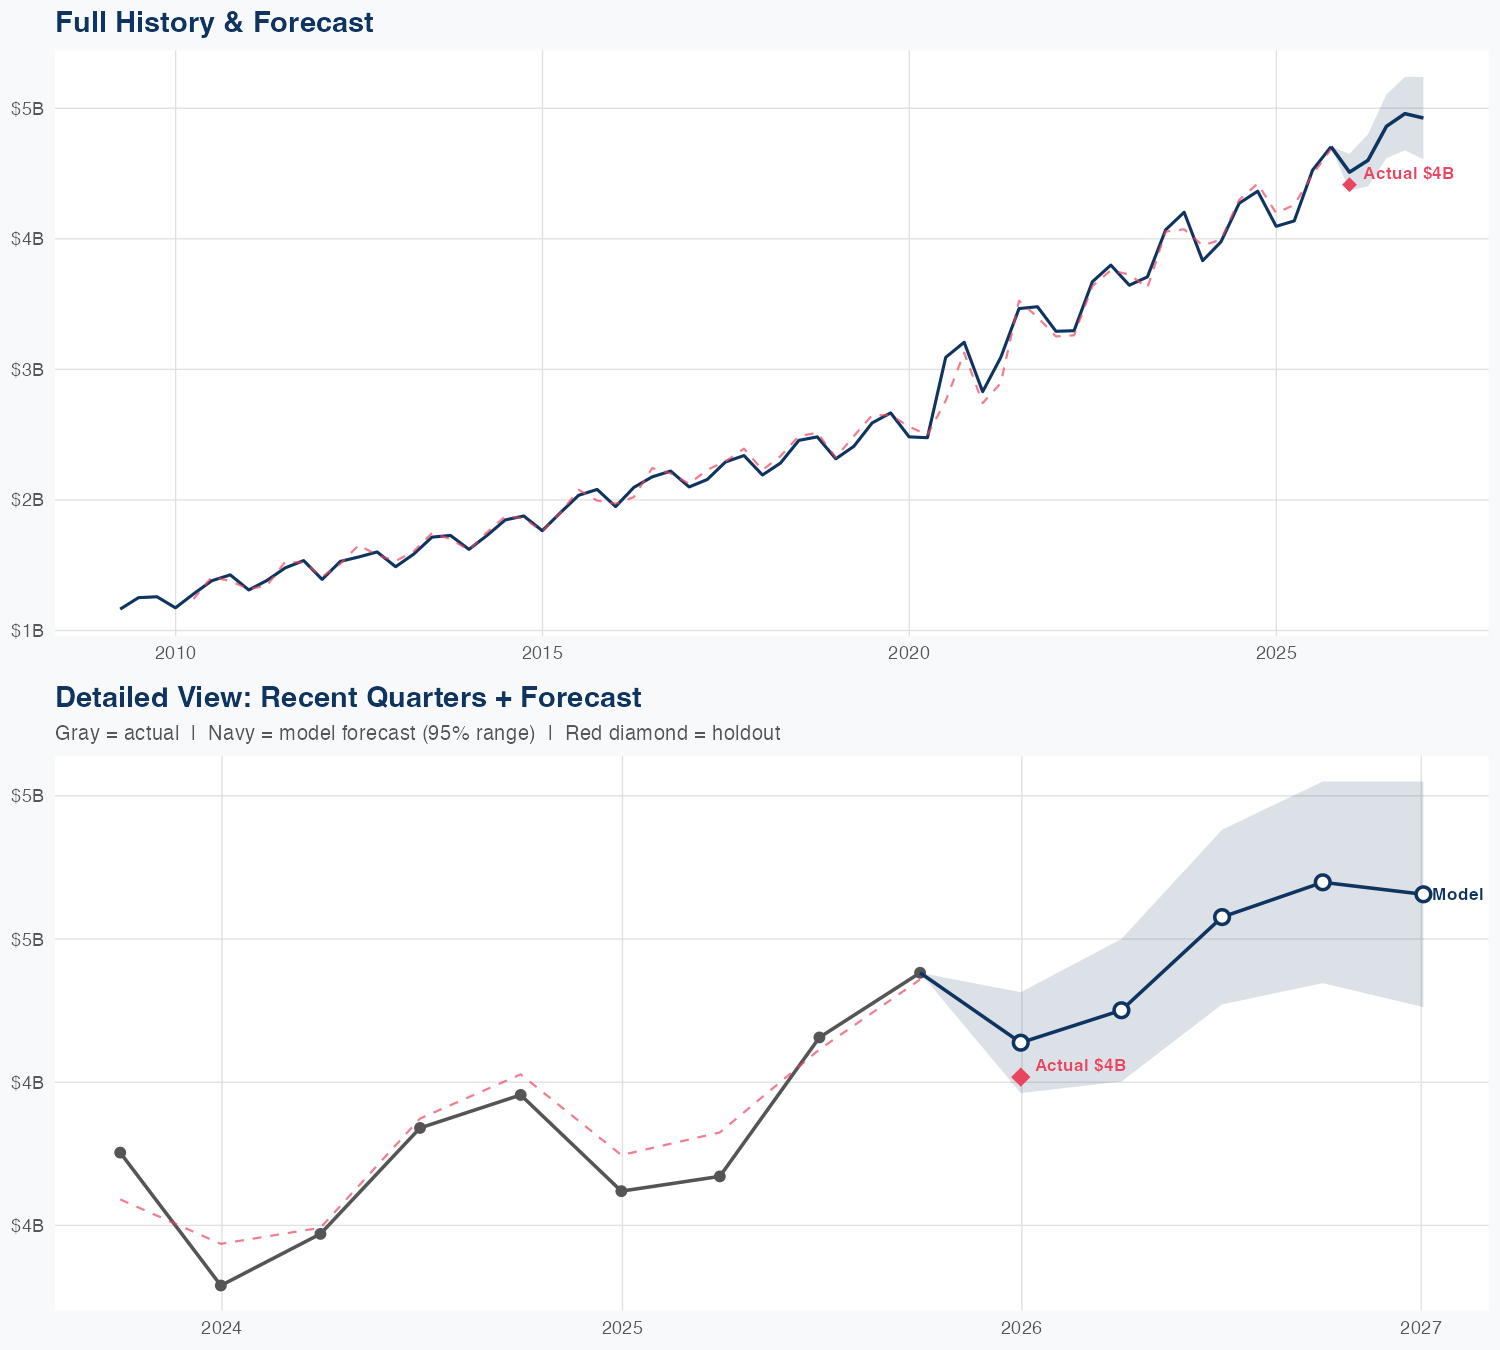
Quarterly Detail
| Quarter | Model Forecast | Actual | 95% Range | YoY Growth | Status |
|---|---|---|---|---|---|
| Q4 2025 | $4.5B | $4.4B | $4.4B – $4.7B | +10.1% | ✓ In range |
| Q2 2026 | $4.6B | $4.4B – $4.8B | +11.2% | ||
| Q3 2026 | $4.9B | $4.6B – $5.1B | +7.4% | ||
| Q4 2026 | $5.0B | $4.7B – $5.2B | +5.4% | ||
| Q1 2027 | $4.9B | $4.6B – $5.2B | +11.6% |
Seasonal Factors
| Fiscal Quarter | Seasonal Factor | vs Trend | Interpretation | Obs. |
|---|---|---|---|---|
| FQ1 (Sep–Nov) | 1.0105 | +1.0% | In line with trend | 16 |
| FQ2 (Dec–Feb) | 0.9885 | -1.1% | In line with trend | 16 |
| FQ3 (Mar–May) | 1.0007 | +0.1% | In line with trend | 16 |
| FQ4 (Jun–Aug) | 0.9854 | -1.5% | In line with trend | 16 |
How Spending Drives Revenue
Want this analysis for your portfolio?
I build custom revenue intelligence reports for investors and companies using SEC filing data, econometric modeling, and AI-powered insights.
Get in Touch