Phillips 66 PSX
Revenue Intelligence Report • 60 quarters of SEC filing data • Updated 2026-03-15
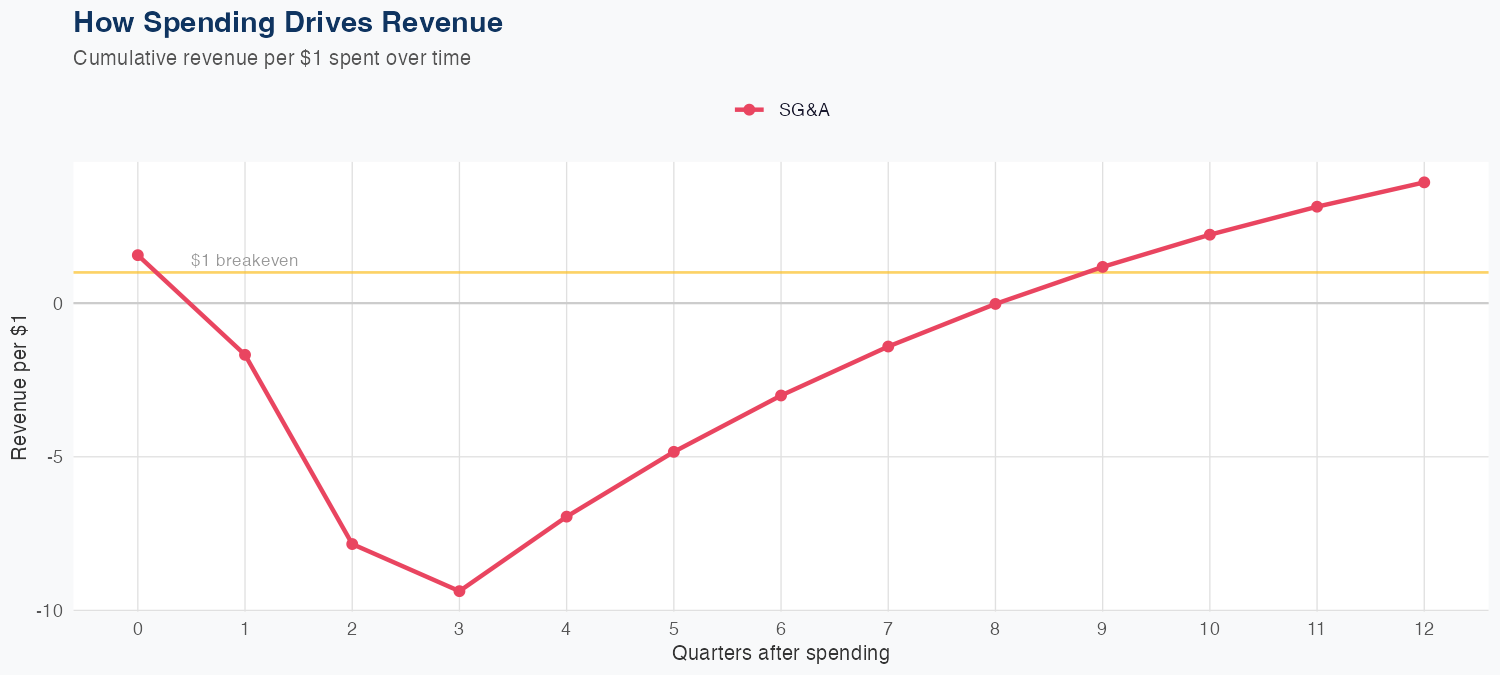
In our econometric model, PSX's FY revenue of $128B, down 3.7% YoY, looks driven by softer demand and margin compression rather than a pure volume decline. Elasticities imply growth hinges on throughput and margins rather than price, with SG&A efficiency of $3.93 of revenue per $1 of SG&A signaling a cost base that can support margin expansion as volumes recover. The holdout forecast of $32.9B versus $34.1B actual (~3.7% error) and an 11.7% MAPE suggest the model is reasonably reliable but not precise in a volatile refining cycle. Risks include cyclical demand and crack-price shifts that can waver utilization; a rebound in throughput and/or spreads is needed to lift earnings, while capex and regulatory dynamics could tilt the growth path.
Investment Thesis
At 11.7% MAPE, the model captures Phillips 66's broad revenue trajectory, though quarterly variability suggests sensitivity to external factors. Each $1 of SG&A spending generates $3.93 in revenue, reflecting strong commercial efficiency.
Revenue Forecast
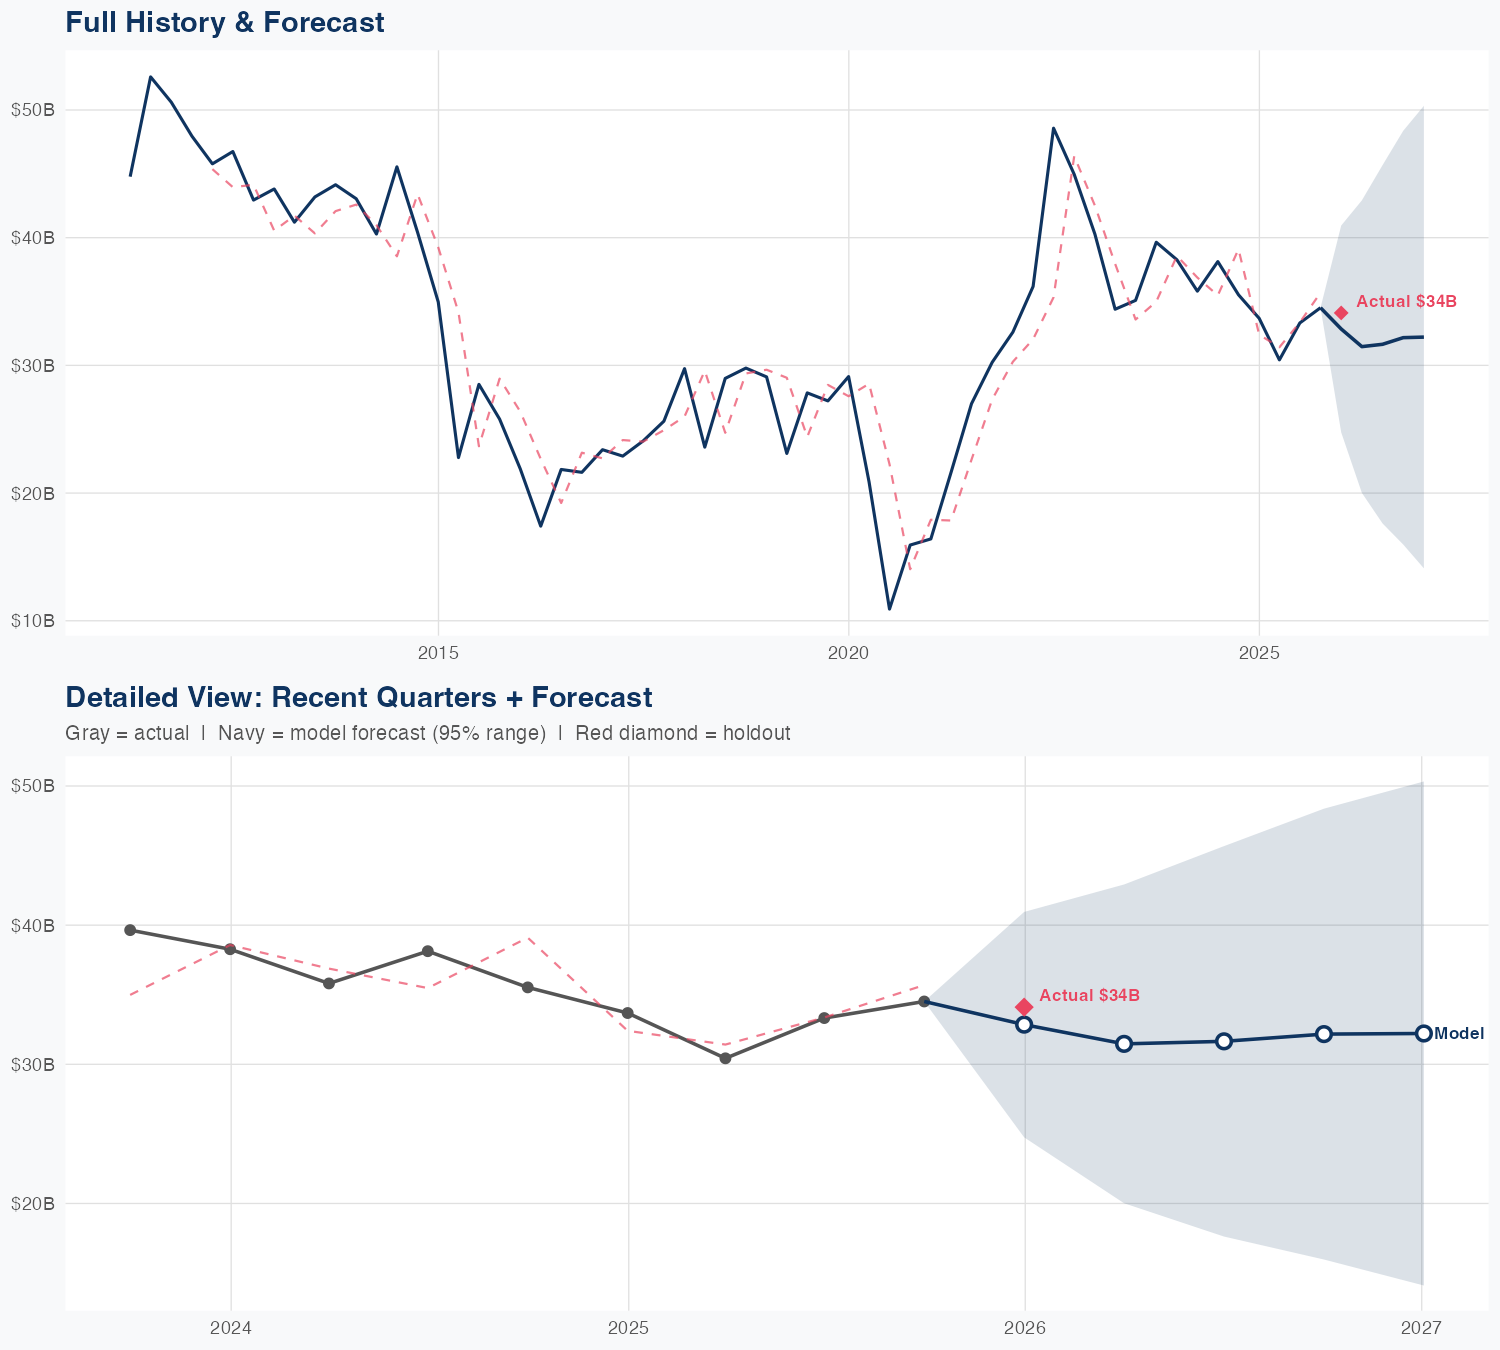
Quarterly Detail
| Quarter | Model Forecast | Actual | 95% Range | YoY Growth | Status |
|---|---|---|---|---|---|
| Q4 2025 | $33B | $34B | $25B – $41B | -2.5% | ✓ In range |
| Q2 2026 | $31B | $20B – $43B | +3.4% | ||
| Q3 2026 | $32B | $18B – $46B | -5.0% | ||
| Q4 2026 | $32B | $16B – $48B | -6.8% | ||
| Q1 2027 | $32B | $14B – $50B | -5.6% |
Seasonal Factors
| Fiscal Quarter | Seasonal Factor | vs Trend | Interpretation | Obs. |
|---|---|---|---|---|
| FQ1 (Sep–Nov) | 0.9729 | -2.7% | In line with trend | 14 |
| FQ2 (Dec–Feb) | 1.0299 | +3.0% | In line with trend | 14 |
| FQ3 (Mar–May) | 0.9685 | -3.1% | -3.1% below trend | 14 |
| FQ4 (Jun–Aug) | 1.1367 | +13.7% | +13.7% above trend | 14 |
How Spending Drives Revenue
Want this analysis for your portfolio?
I build custom revenue intelligence reports for investors and companies using SEC filing data, econometric modeling, and AI-powered insights.
Get in Touch