Paypal Holdings, Inc. PYPL
Revenue Intelligence Report • 18 quarters of SEC filing data • Updated 2026-03-15
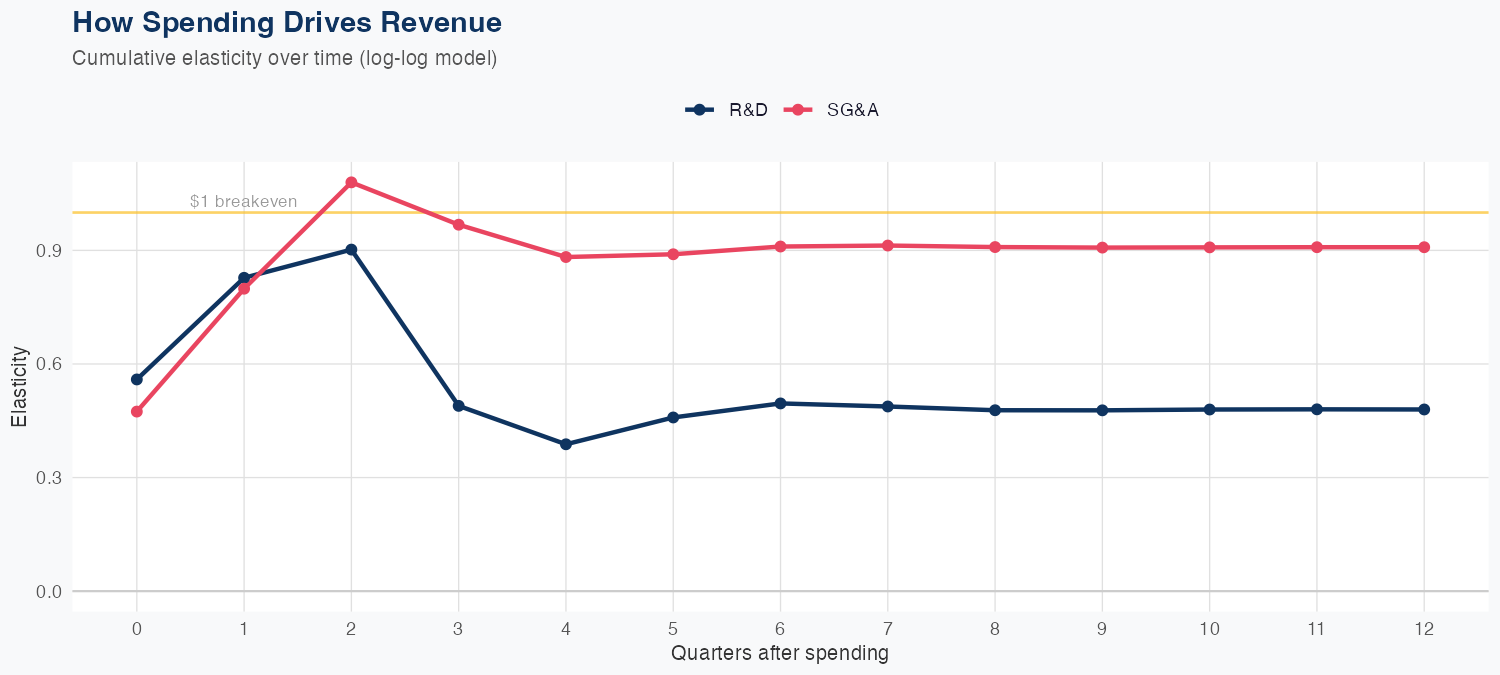
Revenue growth is driven by operating spend, with SG&A elasticity at 0.91 and R&D elasticity at 0.48 in a log-log model, meaning SG&A investments yield nearly 1% revenue lift per 1% spend—more leverage than R&D. The model shows strong reliability (MAPE 1.0% across 18 quarters) with a holdout test miss of 5.8% (predicted 4.0B vs actual 4.2B), indicating solid forecasting accuracy overall. The FY outlook calls for about $18B in revenue, up 18.2% year over year, signaling robust top-line momentum. Taken together, the ROI of SG&A spending appears robust relative to R&D, supporting a favorable growth trajectory, while profitability will depend on margin discipline as the business scales.
Investment Thesis
Our ARDL model tracks Paypal Holdings, Inc.'s revenue with exceptional precision (1.0% MAPE), indicating highly predictable cash flows. R&D investment shows a 0.48x multiplier — each 1% increase in R&D spend is associated with a 0.48% revenue increase, signaling strong innovation-to-revenue conversion. Sales & marketing spend shows a 0.91x elasticity, suggesting effective go-to-market execution.
Revenue Forecast
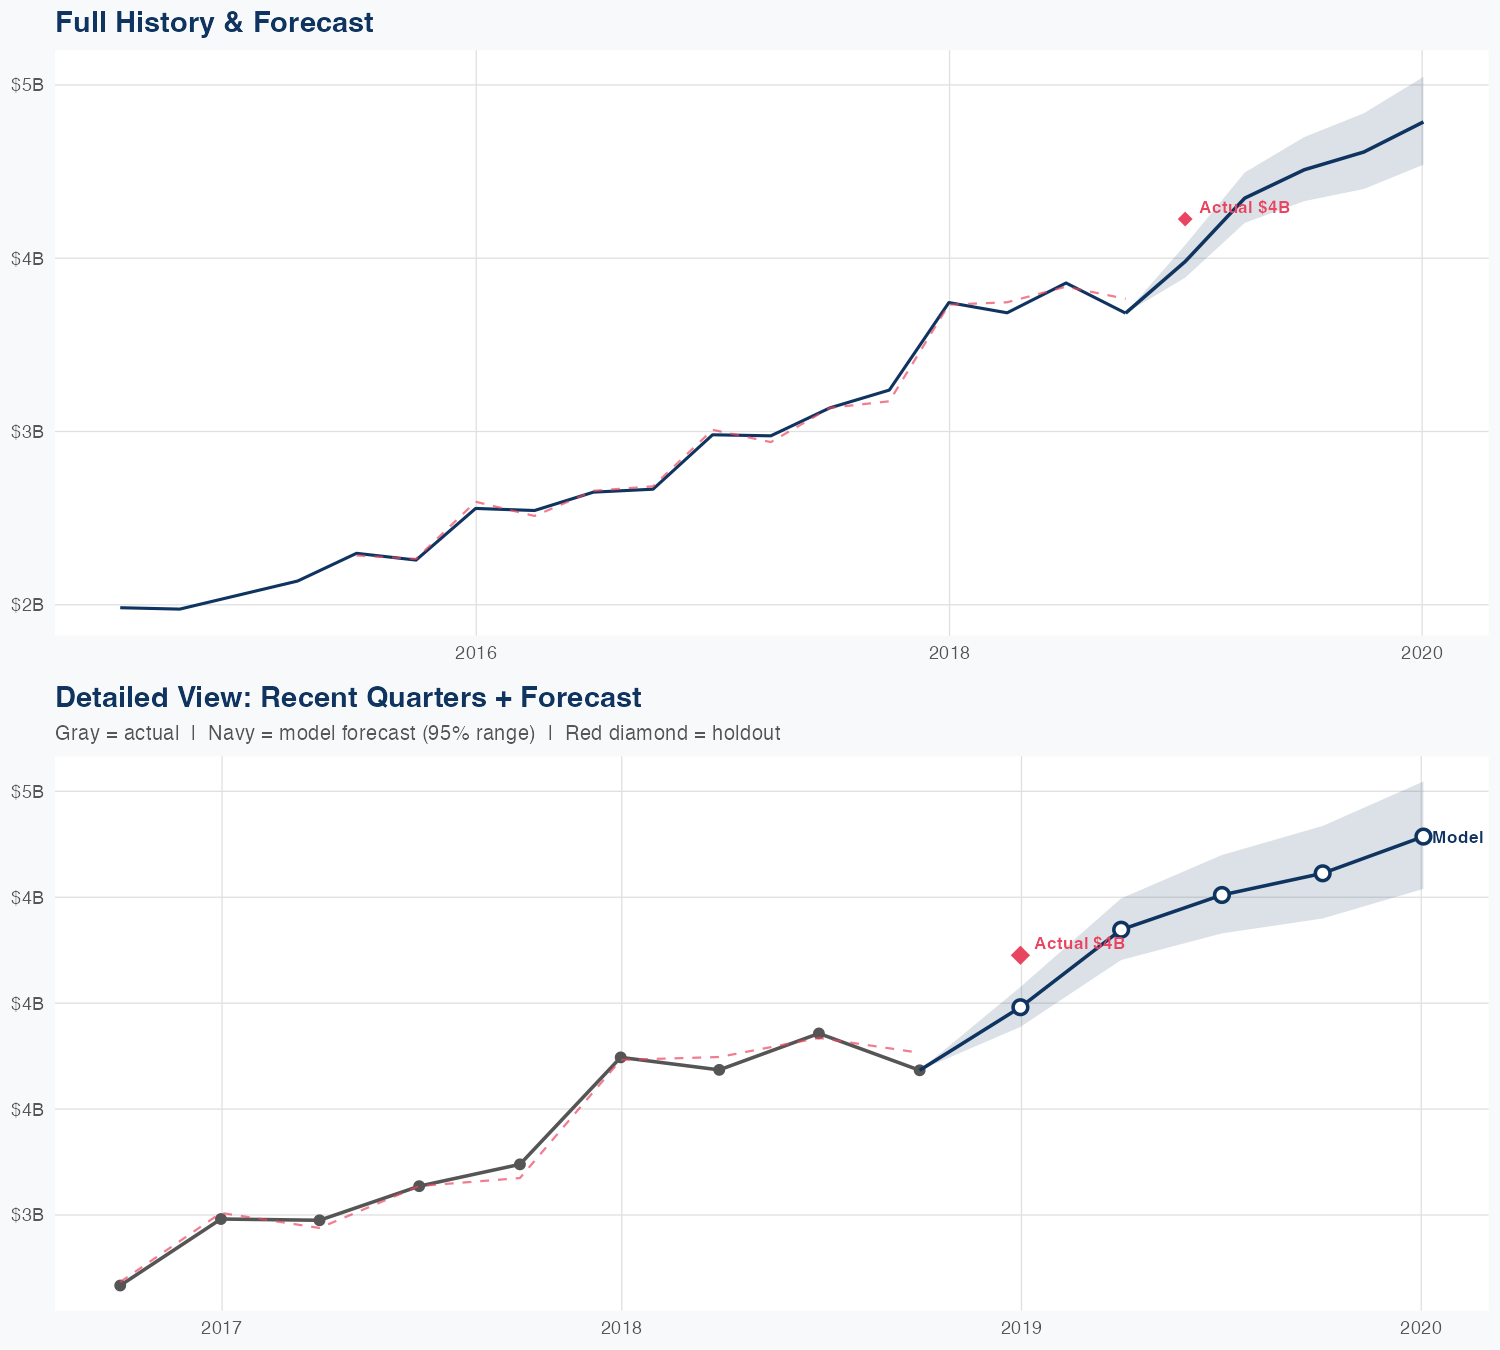
Quarterly Detail
| Quarter | Model Forecast | Actual | 95% Range | YoY Growth | Status |
|---|---|---|---|---|---|
| Q4 2018 | $4.0B | $4.2B | $3.9B – $4.1B | +6.3% | ✗ Outside range |
| Q2 2019 | $4.3B | $4.2B – $4.5B | +18.0% | ||
| Q3 2019 | $4.5B | $4.3B – $4.7B | +16.9% | ||
| Q4 2019 | $4.6B | $4.4B – $4.8B | +25.2% | ||
| Q1 2020 | $4.8B | $4.5B – $5.0B | +13.3% |
Seasonal Factors
| Fiscal Quarter | Seasonal Factor | vs Trend | Interpretation | Obs. |
|---|---|---|---|---|
| FQ1 (Sep–Nov) | 0.997 | -0.3% | In line with trend | 4 |
| FQ2 (Dec–Feb) | 1.0032 | +0.3% | In line with trend | 4 |
| FQ3 (Mar–May) | 1.0123 | +1.2% | In line with trend | 3 |
| FQ4 (Jun–Aug) | 1.0054 | +0.5% | In line with trend | 4 |
How Spending Drives Revenue
Want this analysis for your portfolio?
I build custom revenue intelligence reports for investors and companies using SEC filing data, econometric modeling, and AI-powered insights.
Get in Touch